Analysis scripts: K. pneumoniae in QECH
Source:vignettes/PublicationFigures.Rmd
PublicationFigures.Rmd
library(QECHospitalKlebs)
library(MetBrewer)
library(ggtree)
#> ggtree v3.9.1 For help: https://yulab-smu.top/treedata-book/
#>
#> If you use the ggtree package suite in published research, please cite
#> the appropriate paper(s):
#>
#> Guangchuang Yu, David Smith, Huachen Zhu, Yi Guan, Tommy Tsan-Yuk Lam.
#> ggtree: an R package for visualization and annotation of phylogenetic
#> trees with their covariates and other associated data. Methods in
#> Ecology and Evolution. 2017, 8(1):28-36. doi:10.1111/2041-210X.12628
#>
#> Guangchuang Yu.  Data Integration, Manipulation and Visualization of
#> Phylogenetic Trees (1st edition). Chapman and Hall/CRC. 2022,
#> doi:10.1201/9781003279242
#>
#> LG Wang, TTY Lam, S Xu, Z Dai, L Zhou, T Feng, P Guo, CW Dunn, BR
#> Jones, T Bradley, H Zhu, Y Guan, Y Jiang, G Yu. treeio: an R package
#> for phylogenetic tree input and output with richly annotated and
#> associated data. Molecular Biology and Evolution. 2020, 37(2):599-603.
#> doi: 10.1093/molbev/msz240
library(ggnewscale)
library(ggplot2)
library(tidyverse)
#> ── Attaching core tidyverse packages ──────────────────────── tidyverse 2.0.0 ──
#> ✔ dplyr     1.1.3     ✔ readr     2.1.4
#> ✔ forcats   1.0.0     ✔ stringr   1.5.0
#> ✔ lubridate 1.9.3     ✔ tibble    3.2.1
#> ✔ purrr     1.0.2     ✔ tidyr     1.3.0
#> ── Conflicts ────────────────────────────────────────── tidyverse_conflicts() ──
#> ✖ tidyr::expand() masks ggtree::expand()
#> ✖ dplyr::filter() masks stats::filter()
#> ✖ dplyr::lag()    masks stats::lag()
#> ℹ Use the conflicted package (<http://conflicted.r-lib.org/>) to force all conflicts to become errors
library(patchwork)
library(rPinecone)
#> Warning: replacing previous import 'ape::ring' by 'igraph::ring' when loading
#> 'rPinecone'
#> Warning: replacing previous import 'ape::edges' by 'igraph::edges' when loading
#> 'rPinecone'
#> Warning: replacing previous import 'ape::mst' by 'igraph::mst' when loading
#> 'rPinecone'
#> Warning: replacing previous import 'ape::degree' by 'igraph::degree' when
#> loading 'rPinecone'
#> Warning: replacing previous import 'igraph::diversity' by 'phangorn::diversity'
#> when loading 'rPinecone'
library(reshape2)
#>
#> Attaching package: 'reshape2'
#>
#> The following object is masked from 'package:tidyr':
#>
#>     smiths
library(castor)
#> Loading required package: Rcpp
'%nin%' <- Negate('%in%')
Introduction
This document generates the tables and figures for the manuscript:
Longitudinal analysis within one hospital in sub-Saharan Africa over 20 years reveals repeated replacements of dominant clones of Klebsiella pneumoniae and stresses the importance to include temporal patterns for vaccine design considerations
Eva Heinz1,2, Oliver Pearse2,3, Allan Zuza3, Sithembile Bilima3, Chisomo Msefula4, Patrick Musicha2,3, Patriciah Siyabu5, Edith Tewesa5, Fabrice E Graf2, Rebecca Lester3,6, Samantha Lissauer3,7, Jennifer Cornick3,7, Joseph M Lewis2,3,7, Kondwani Kawaza3,4, Nicholas R Thomson8,9, Nicholas A Feasey2,3,10
- Department of Vector Biology, Liverpool School of Tropical Medicine, Liverpool, UK
- Department of Clinical Sciences, Liverpool School of Tropical Medicine, Liverpool, UK
- Malawi Liverpool Wellcome Programme, Kamuzu University of Health Sciences, Blantyre, Malawi
- Kamuzu University of Health Sciences, Blantyre, Malawi
- Queen Elizabeth Central Hospital, Blantyre, Malawi
- Division of Infection & Immunity, University College London, UK
- Department of Clinical Infection, Microbiology and Immunology, University of Liverpool, Liverpool, UK
- Parasites and Microbes Program, Wellcome Sanger Institute, Hinxton, UK
- London School of Hygiene and Tropical Medicine, London, UK
- School of Medicine, St Andrews University, UK
STs over time, wards over time
STsoT <- ggplot(kleborate_big[!is.na(kleborate_big$DATE) & kleborate_big$DATE > 1999,]) + geom_bar(aes(x = DATE, group = main_ST, fill= main_ST)) + theme_bw() + scale_fill_manual(values=c("lightgrey", met.brewer("Redon", 21)), name="Main STs") + theme(axis.text.x = element_text(angle = 90, hjust = 1)) + labs(title = "Sequence types over time", x = "Date", y = "Number of isolates")

STsoT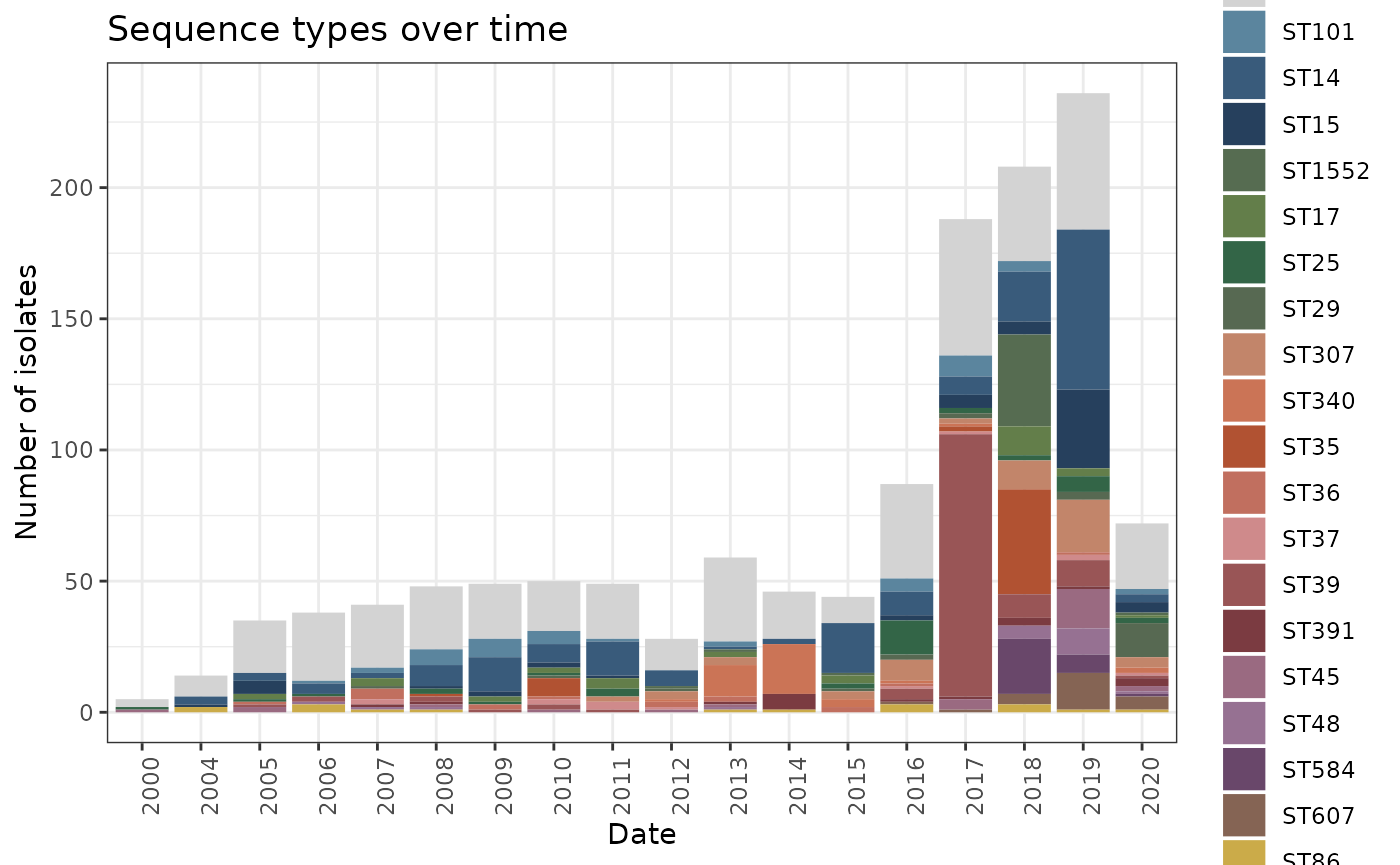
WoT <- ggplot(LIMS_kleborate[!is.na(LIMS_kleborate$DATE) & LIMS_kleborate$DATE > 1999,]) + geom_bar(aes(x = DATE, group = major_wards, fill= major_wards)) + theme_bw() + scale_fill_manual(values=ward_col, name = "Major wards") + theme(axis.text.x = element_text(angle = 90, hjust = 1)) + xlab("Date") + ylab("Number of isolates") + ggtitle("Wards over time")

WoT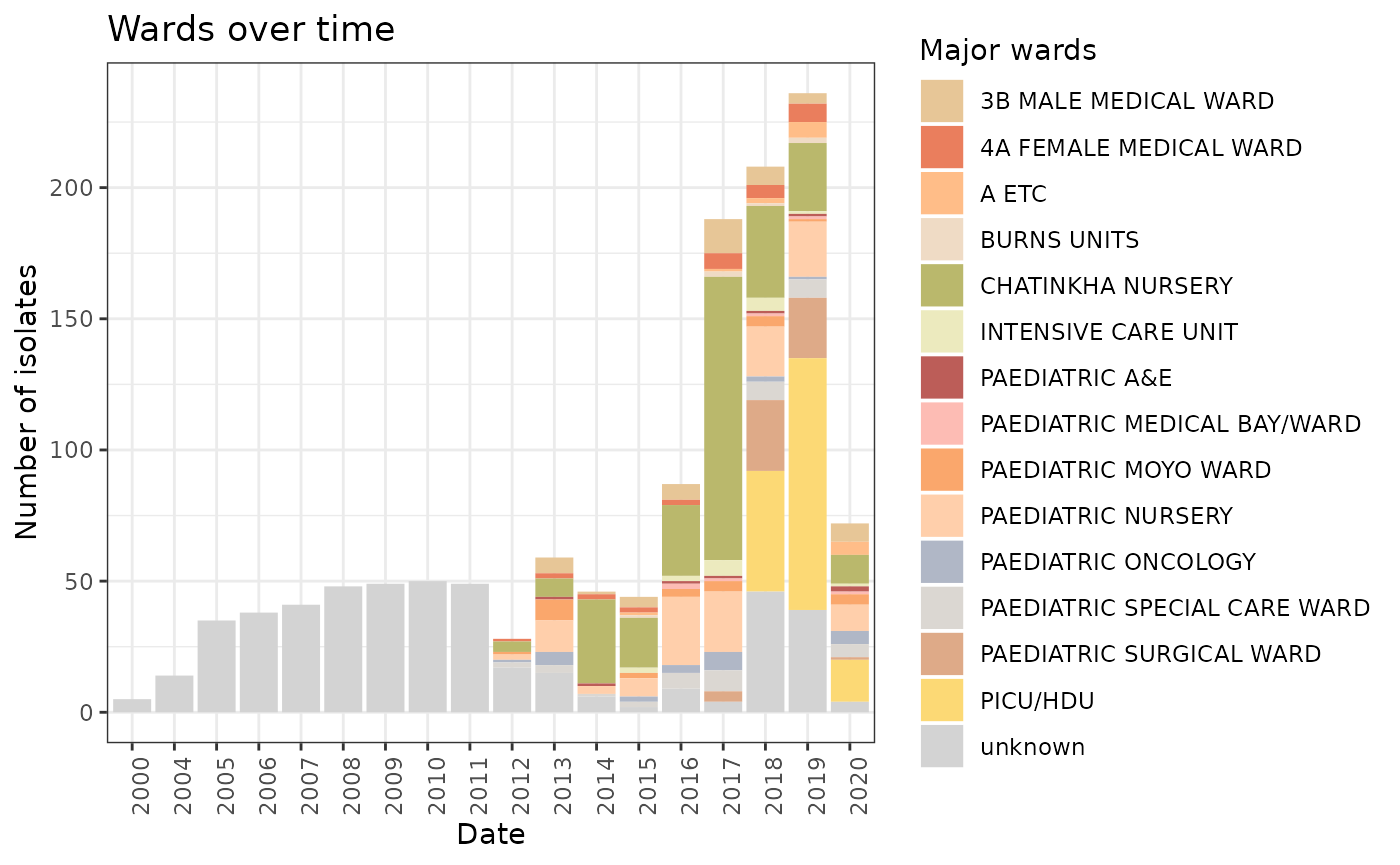
wards_STs <- LIMS_kleborate[!is.na(LIMS_kleborate$DATE),] %>% group_by(main_ST, DATE, major_wards) %>% summarise(wards_STs_sum=length(c(main_ST, DATE, major_wards)))
#> `summarise()` has grouped output by 'main_ST', 'DATE'. You can override using
#> the `.groups` argument.

wards_STs <- wards_STs[wards_STs$major_wards != "unknown",]

ggplot(wards_STs) + geom_point(aes(x=DATE, y=wards_STs_sum, group=major_wards, col=major_wards)) + theme_bw() + facet_wrap(~main_ST) + scale_colour_manual(values=ward_col, name="Major wards") + theme(axis.text.x = element_text(angle = 90, hjust = 1)) + xlab("Date") + ylab("Number of isolates") + ggtitle("Major STs per wards")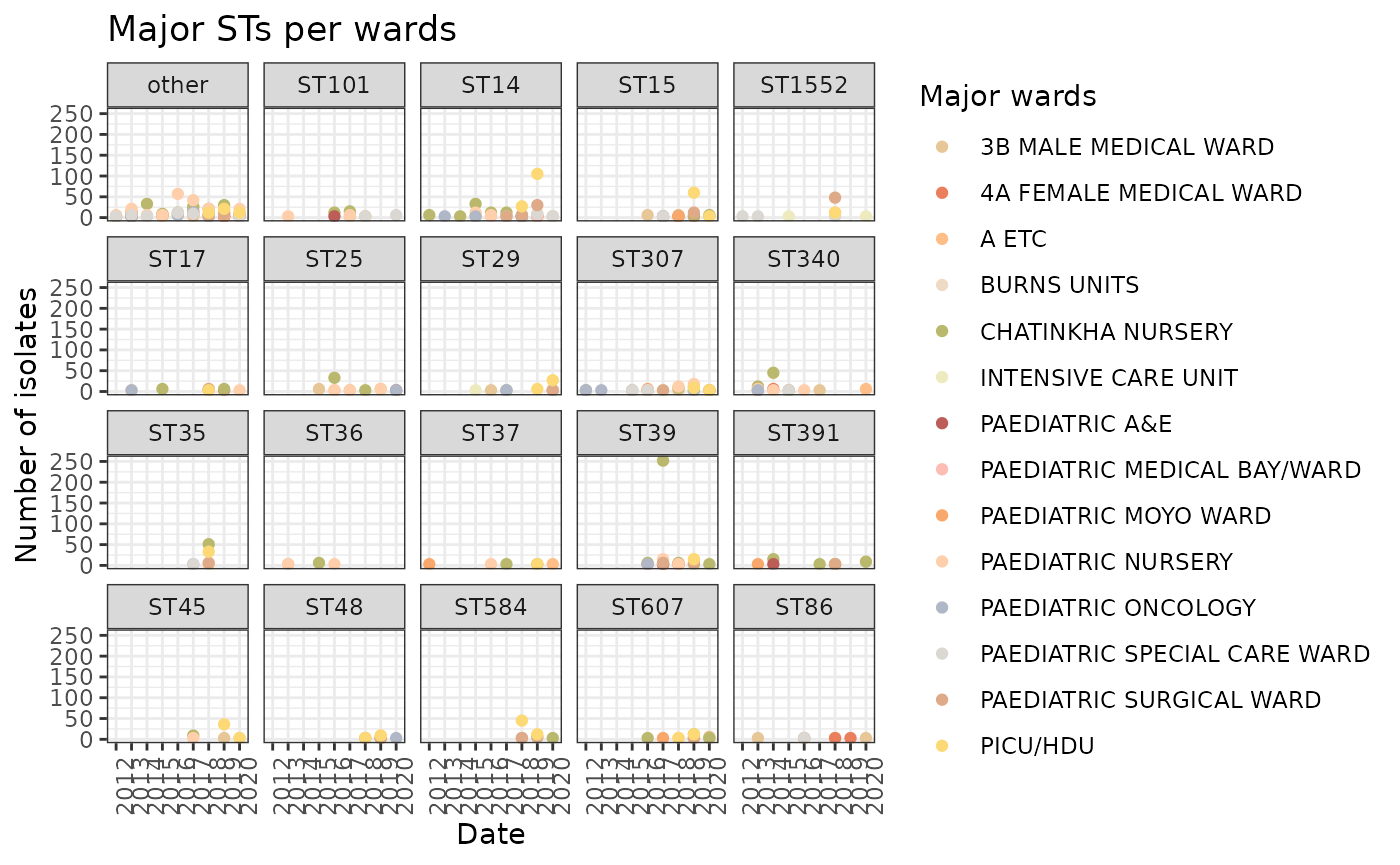
Full ariba predictions mapped to trees
#Rerooting between variicola and quasi for display
p <- ggtree(phytools::reroot(test_tree, 1497)) + geom_tiplab(align=T, size=0.2)

df_species <- as.data.frame(kleborate_big$species)
row.names(df_species) <- kleborate_big$strain
p1 <- gheatmap(p, df_species, colnames=FALSE, width = 0.02, offset = 0.02, colnames_offset_y = 10) + scale_fill_manual(values=species_col)
#> Scale for y is already present.
#> Adding another scale for y, which will replace the existing scale.
#> Scale for fill is already present.
#> Adding another scale for fill, which will replace the existing scale.

df_ST <- as.data.frame(kleborate_big$main_ST)
row.names(df_ST) <- kleborate_big$strain
p2 <- p1 + new_scale_fill()
p2 <- gheatmap(p1, df_ST, colnames=FALSE, width = 0.02, offset = 0.04, colnames_offset_y = 10) + scale_fill_manual(values=c(species_col, main_ST_col))
#> Scale for fill is already present.
#> Adding another scale for fill, which will replace the existing scale.
#> Scale for y is already present.
#> Adding another scale for y, which will replace the existing scale.
#> Scale for fill is already present.
#> Adding another scale for fill, which will replace the existing scale.

df_sample <- as.data.frame(kleborate_big$DESCRIPTION)
row.names(df_sample) <- kleborate_big$strain
p3 <- p2 + new_scale_fill()
p3 <- gheatmap(p2, df_sample, colnames=FALSE, width = 0.02, offset = 0.06, colnames_offset_y = 10) + scale_fill_manual(values=c(species_col, main_ST_col, sample_col))
#> Scale for fill is already present.
#> Adding another scale for fill, which will replace the existing scale.
#> Scale for y is already present.
#> Adding another scale for y, which will replace the existing scale.
#> Scale for fill is already present.
#> Adding another scale for fill, which will replace the existing scale.

df_year <- as.data.frame(kleborate_big$DATE)
row.names(df_year) <- kleborate_big$strain
df_year$`kleborate_big$DATE` <- as.character(df_year$`kleborate_big$DATE`)
p4 <- p3 + new_scale_fill()
p4 <- gheatmap(p3, df_year, colnames=FALSE, width = 0.02, offset = 0.08, colnames_offset_y = 10) + scale_fill_manual(values=c(species_col, main_ST_col, sample_col, date_col))
#> Scale for fill is already present.
#> Adding another scale for fill, which will replace the existing scale.
#> Scale for y is already present.
#> Adding another scale for y, which will replace the existing scale.
#> Scale for fill is already present.
#> Adding another scale for fill, which will replace the existing scale.

#variicola <- kleborate[kleborate$species == "Klebsiella_variicola_subsp._variicola",]$strain
#quasiqupneumoniae <- kleborate[kleborate$species == "Klebsiella_quasipneumoniae_subsp._quasipneumoniae",]$strain
#quasisimpneumoniae <- kleborate[kleborate$species ==   "Klebsiella_quasipneumoniae_subsp._similipneumoniae",]$strain
#pneumoniae <- kleborate[kleborate$species == "Klebsiella_pneumoniae",]$strain

plasmid_hits <- grep("ref_seq", colnames(ariba_plasmid))
plasmid_assembled <- grep("assembled", colnames(ariba_plasmid))
ariba_plasmid <- ariba_plasmid[-c(plasmid_hits, plasmid_assembled)]

ariba_plasmid[ariba_plasmid == "yes"] <- 1
ariba_plasmid[ariba_plasmid == "no"] <- 0

ariba_plasmid <- ariba_plasmid %>% mutate_at(vars(Col156:repUS57), as.numeric)
row.names(ariba_plasmid) <- ariba_plasmid$name
ariba_plasmid <- ariba_plasmid[-1]

plasmid_numbers <- as.data.frame(rowSums(ariba_plasmid))
plasmid_numbers$lane <- row.names(plasmid_numbers)
colnames(plasmid_numbers) <- c("plasmids", "lane")

AMR_hits <- grep("ref_seq", colnames(ariba_full_AMR))
AMR_assembled <- grep("assembled", colnames(ariba_full_AMR))
ariba_AMR <- ariba_full_AMR[-c(AMR_hits, AMR_assembled)]

ariba_AMR[ariba_AMR == "yes"] <- 1
ariba_AMR[ariba_AMR == "no"] <- 0

ariba_AMR <- ariba_AMR %>% mutate_at(vars(ACT_MIR_Bla_2:Zn_dependent_hydrolase_Bla), as.numeric)
row.names(ariba_AMR) <- ariba_AMR$name
ariba_AMR <- ariba_AMR[-1]

AMR_numbers <- as.data.frame(rowSums(ariba_AMR))
AMR_numbers$lane <- row.names(AMR_numbers)
colnames(AMR_numbers) <- c("AMR", "lane")

AMR_plasmid <- merge(AMR_numbers, plasmid_numbers, by = "lane")
AMR_plasmid_Y <- merge(AMR_plasmid, kleborate_big[,c(1,102)], by.x="lane", by.y="strain")

#For plots go over time: create a separate df that removed the ones with "NA" for time, i.e. where date of isolation is unknown.
AMR_plasmid_time <- AMR_plasmid_Y[!is.na(AMR_plasmid_Y$DATE),]
AMR_plasmid_time <- AMR_plasmid_time[AMR_plasmid_time$DATE != "NA",]

AMR_plasmid_time$AMR_group <- AMR_plasmid_time$AMR
AMR_plasmid_time[AMR_plasmid_time$AMR < 21,]$AMR_group <- "0-20"
AMR_plasmid_time[AMR_plasmid_time$AMR > 20,]$AMR_group <- "21-30"

AMR_plasmid_time$plasmid_group <- AMR_plasmid_time$plasmids
AMR_plasmid_time[AMR_plasmid_time$plasmids > 5,]$plasmid_group <- "6-11"
AMR_plasmid_time[AMR_plasmid_time$plasmids < 6,]$plasmid_group <- "0-5"
#factor_variable <- factor(factor_variable, levels=c('this', 'that', 'those', ...))

AMR_time <- ggplot(AMR_plasmid_time) + geom_bar(aes(x = DATE, group = as.factor(AMR_group), fill= as.factor(AMR_group))) + theme_bw() + scale_fill_manual(values=c("#7ba0b4","#c27668"), name="AMR genes") + theme(axis.text.x = element_text(angle = 90, hjust = 1)) + xlab("Date") + ylab("Number of isolates") + ggtitle("AMR gene numbers per isolate over time")

plasm_time <- ggplot(AMR_plasmid_time[!is.na(AMR_plasmid_time$DATE) & AMR_plasmid_time$DATE > 1999,]) + geom_bar(aes(x = DATE, group = as.factor(plasmid_group), fill= as.factor(plasmid_group))) + theme_bw() + scale_fill_manual(values=c("#7ba0b4","#c27668"), name="Plasmid replicons") + theme(axis.text.x = element_text(angle = 90, hjust = 1)) + xlab("Date") + ylab("Number of isolates") + ggtitle("Plasmid replicons per isolate over time")

plasm_time + AMR_time + plot_annotation(title = "Figure S6", tag_levels = "A", tag_suffix = ")") 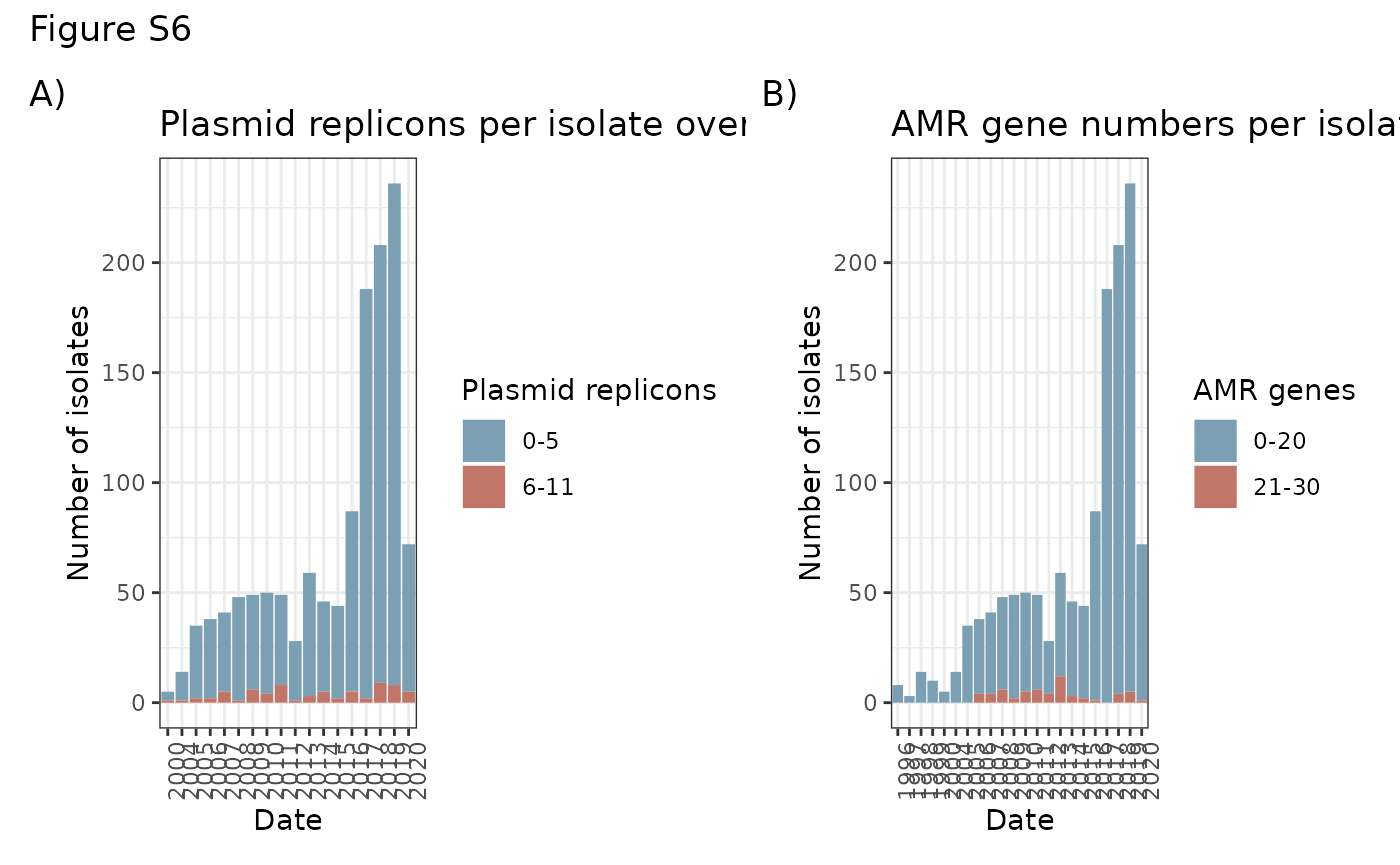
p5 <- p4 + new_scale_fill()
gheatmap(p5, ariba_plasmid, low="#b0b7c6", high="#1a4876", colnames=TRUE, colnames_angle=45, font.size=0.5, colnames_position = "top", offset=0.1)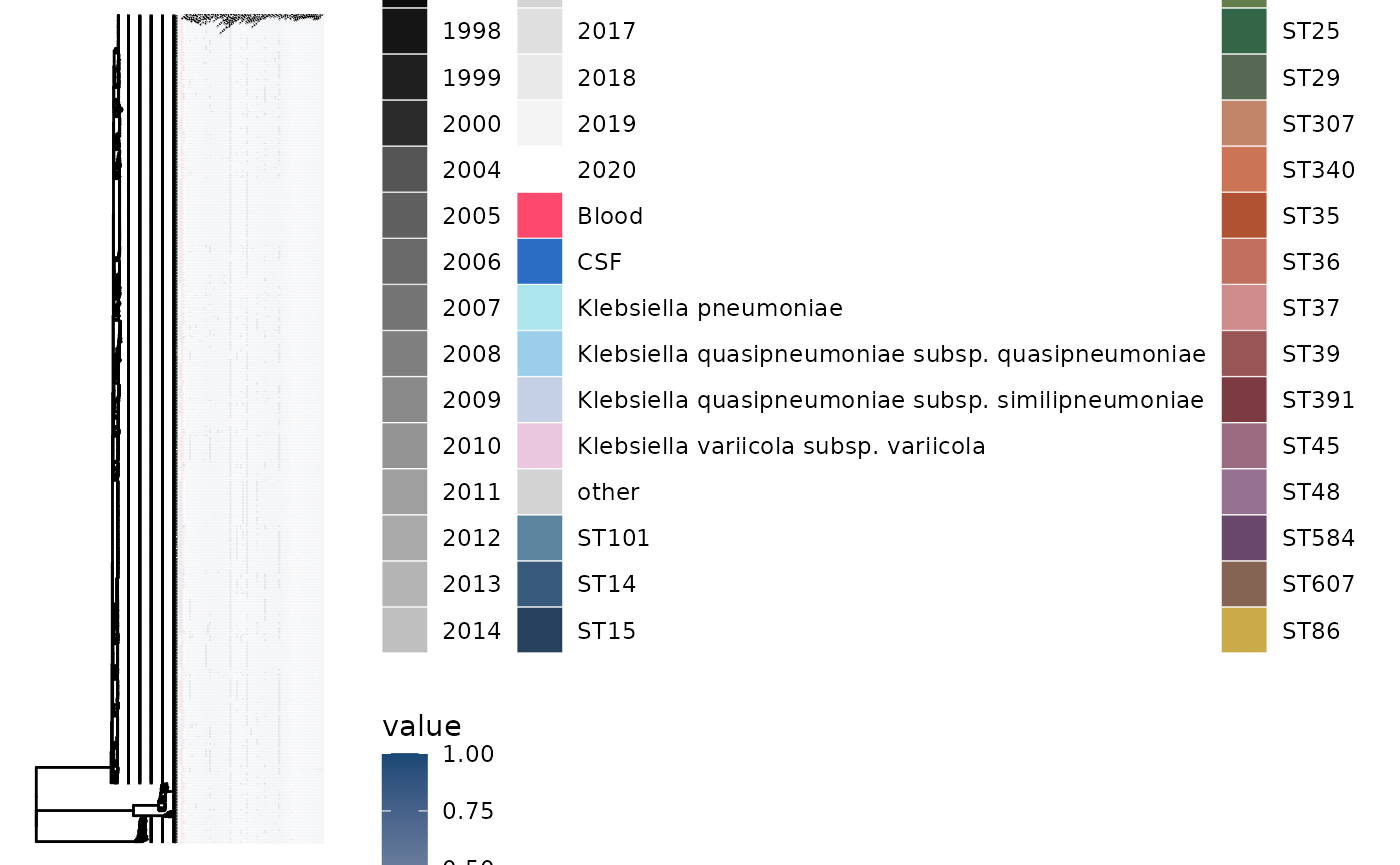
gheatmap(p5, ariba_plasmid, low="#b0b7c6", high="#1a4876", colnames=TRUE, colnames_angle=90, font.size=0.5, colnames_position = "top", colnames_offset_y = 10, offset=0.1) + vexpand(0.1,1)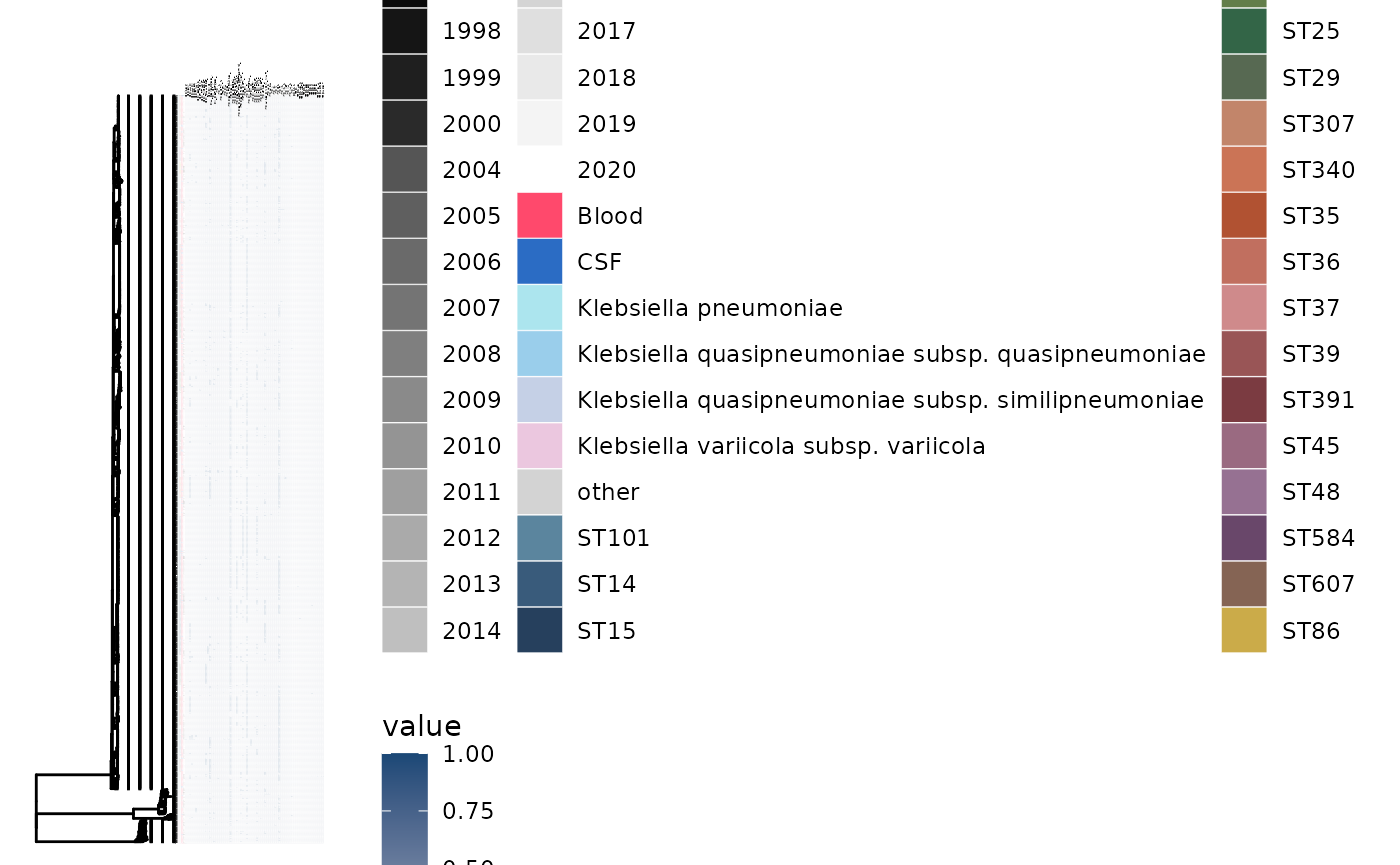
p5 <- p4 + new_scale_fill()
gheatmap(p5, ariba_AMR, low="#fddde6", high="#ca3767", colnames=TRUE, colnames_angle=45, font.size=0.5, colnames_position = "top", offset=0.1)
gheatmap(p5, ariba_AMR, low="#fddde6", high="#ca3767", colnames=TRUE, colnames_angle=45, font.size=0.5, colnames_position = "top", offset=0.1)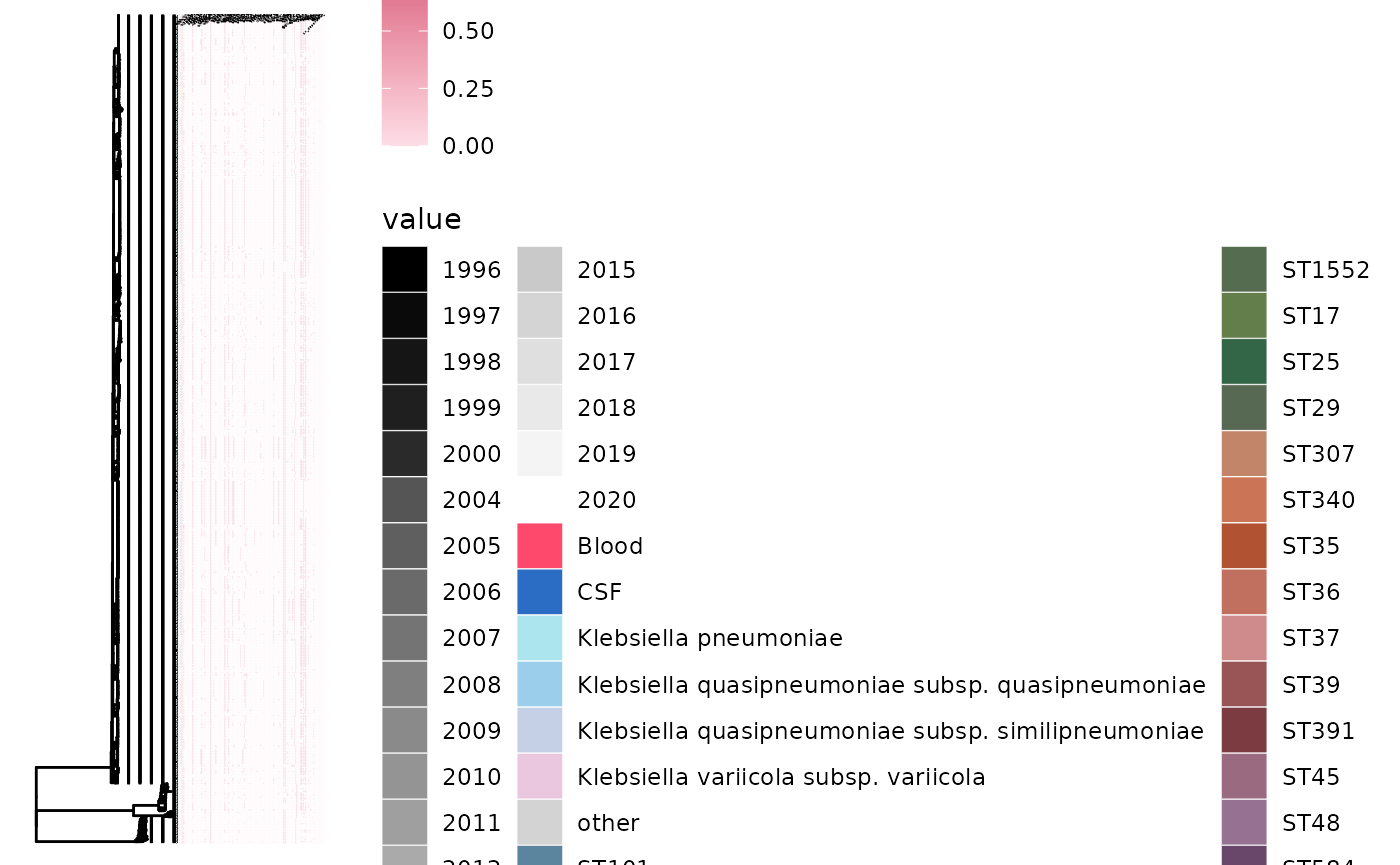
salmo <- dcast(kleborate_big, formula = strain ~ Salmochelin, fun.aggregate = length)
#> Using main_ST as value column: use value.var to override.
salmo <- salmo %>% select(-c(2) )

aero <- dcast(kleborate_big, formula = strain ~ Aerobactin, fun.aggregate = length)
#> Using main_ST as value column: use value.var to override.
aero <- aero %>% select(-c(2) )

ybst <- dcast(kleborate_big, formula = strain ~ Yersiniabactin, fun.aggregate = length)
#> Using main_ST as value column: use value.var to override.
ybst <- ybst %>% select(-c(2) )

RmpADC <- dcast(kleborate_big, formula = strain ~ RmpADC, fun.aggregate = length)
#> Using main_ST as value column: use value.var to override.
RmpADC <- RmpADC %>% select(-c(2) )

rmpA2 <- dcast(kleborate_big, formula = strain ~ rmpA2, fun.aggregate = length)
#> Using main_ST as value column: use value.var to override.
rmpA2 <- rmpA2 %>% select(-c(2) )

coli <- dcast(kleborate_big, formula = strain ~ Colibactin, fun.aggregate = length)
#> Using main_ST as value column: use value.var to override.
coli <- coli %>% select(-c(2) )

virulence <- ybst %>% full_join(coli, by='strain') %>% full_join(aero, by='strain') %>% full_join(salmo, by='strain') %>% full_join(RmpADC, by='strain') %>% full_join(rmpA2, by='strain')

row.names(virulence) <- virulence$strain
virulence <- virulence %>% select(-c('strain') )

p5 <- p4 + new_scale_fill()
gheatmap(p5, virulence, low="#aaf0d1", high="#158078", colnames=TRUE, colnames_angle=45, font.size=0.5, colnames_position = "top", offset=0.1)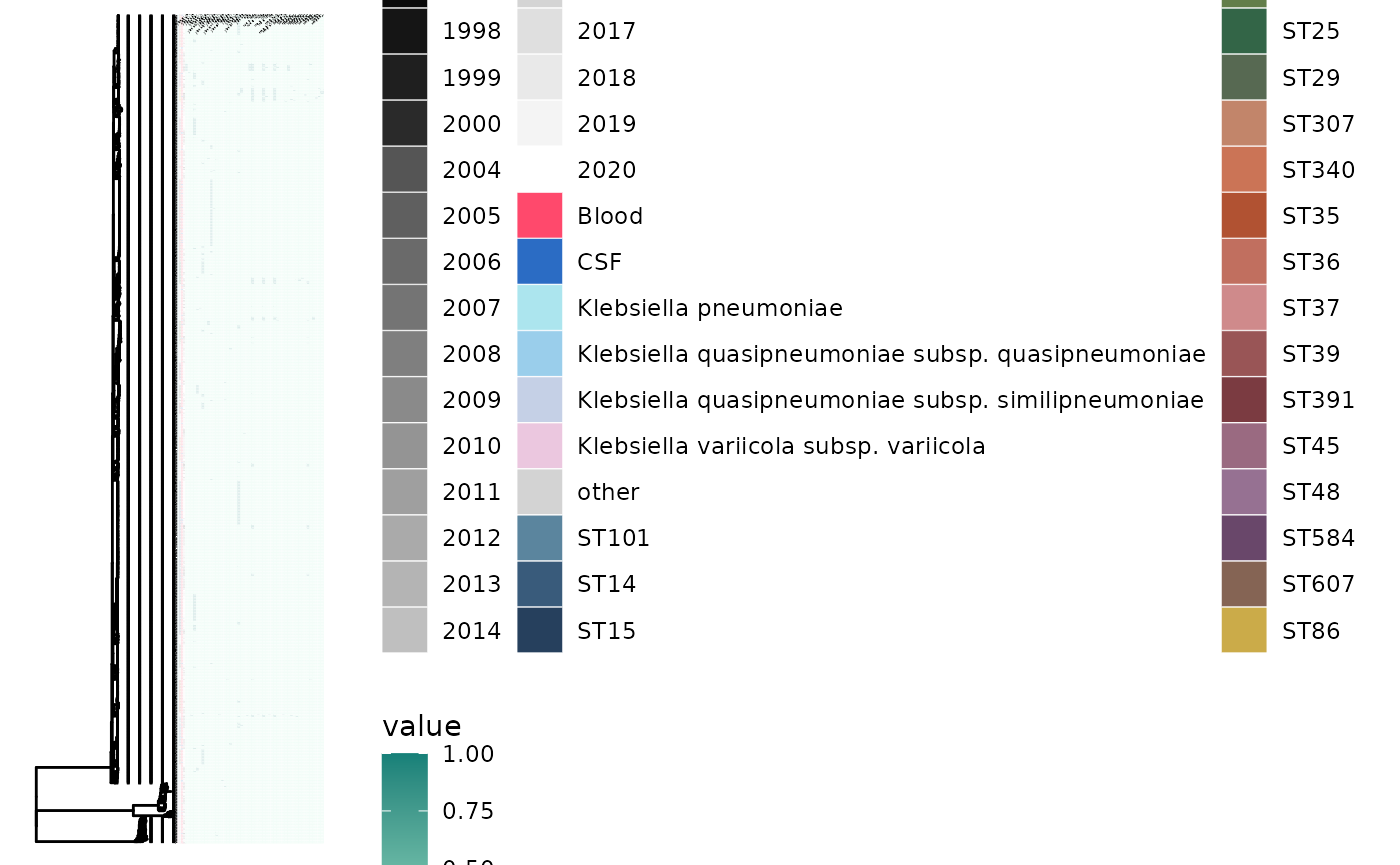
Antimicrobial resistance plots
AMR_classes <- c("Bla", "AGly", "Rif", "Phe", "Tmt", "MLS", "Fcyn", "Flq", "Sul", "Tet", "Gly")

all_AGly <- ariba_full_AMR %>% select(contains("AGly"))
all_AGly_names <- all_AGly %>% select(contains("ref_seq"))
AGly_genes <- lapply(all_AGly_names, unique)

ariba_AMR_genes <- ariba_AMR
ariba_AMR_genes <- ariba_AMR_genes %>% select_if(colSums(.) != 0)
ariba_AGly_genes <- ariba_AMR_genes %>% select(contains("AGly"))
#Need to combine the different columns that all include ANT(3'') into one for simplicity

ariba_AGly_genes$ANT3 <- ariba_AGly_genes$AacAad_AGly + ariba_AGly_genes$AadA4_5_AGly + ariba_AGly_genes$AadA_AGly + ariba_AGly_genes$AadA_AGly_2 + ariba_AGly_genes$AphA6_AGly
ariba_AGly_genes[ariba_AGly_genes$ANT3 > 1,]$ANT3 <- 1
ariba_AGly_genes <- select(ariba_AGly_genes, -c(AacAad_AGly, AadA4_5_AGly, AadA_AGly, AadA_AGly_2, AphA6_AGly))

#Now, mapping the theoretical resistances of clinically relevant AGly's; Gentamycin Gm, Amikazin Amk
ariba_AGly_genes$Gm <- 0
ariba_AGly_genes$Amk <- 0

ariba_AGly_genes[ariba_AGly_genes$AacAad_AGly_3 == 1,]$Amk <- 1
ariba_AGly_genes[ariba_AGly_genes$Aac3_IIa_AGly == 1 | ariba_AGly_genes$AadB_AGly == 1,]$Gm <- 1

#Now, combine this with the 'physical' resistance data and see how often predictions match - can only  look at proportion of strains as not all tested
Amikacin_test <- LIMS_kleborate[!is.na(LIMS_kleborate$`Amikacin 30`),]
ariba_AGly_genes$strain <- row.names(ariba_AGly_genes)
Amikacin_test <- inner_join(Amikacin_test, ariba_AGly_genes, by="strain")

Gentamycin_test <- LIMS_kleborate[!is.na(LIMS_kleborate$`Gentamicin 10`),]
Gentamycin_test <- inner_join(Gentamycin_test, ariba_AGly_genes, by="strain")

Amk_res <- as.data.frame(table(Amikacin_test$Amk, Amikacin_test$`Amikacin 30`))
Gent_res <- as.data.frame(table(Gentamycin_test$Gm, Gentamycin_test$`Gentamicin 10`))

Amk_plot <- ggplot(Amk_res) + geom_bar(aes(x = Var2, y=Freq, fill= Var1), stat = "identity", position="dodge") + theme_bw() + scale_fill_manual(values=c("#7ba0b4","#c27668"), name = "Predicted phenotype", labels = c("Sensitiv", "Resistant")) + xlab("Phenotype") + ylab("Number of isolates") + ggtitle("Phenotype vs predicted amikacin resistance")

Gent_plot <- ggplot(Gent_res) + geom_bar(aes(x = Var2, y=Freq, fill= Var1), stat = "identity", position="dodge") + theme_bw() + scale_fill_manual(values=c("#7ba0b4","#c27668"), name = "Predicted phenotype", labels = c("Sensitiv", "Resistant")) + xlab("Phenotype") + ylab("Number of isolates") + ggtitle("Phenotype vs predicted gentamicin resistance")

#Checking who I predicted to be resistant but is actually sensitive
Amk_sens_res <- Amikacin_test[Amikacin_test$Amk == 1 & Amikacin_test$`Amikacin 30` == "S",]$strain
#Sensitive predicted as sensitive
Amk_sens_sens <- Amikacin_test[Amikacin_test$Amk == 0 & Amikacin_test$`Amikacin 30` == "S",]$strain
#Resistant predicted as sensitive
Amk_res_sens <- Amikacin_test[Amikacin_test$Amk == 0 & Amikacin_test$`Amikacin 30` == "R",]$strain
#Resistant predicted as resistant
Amk_res_res <- Amikacin_test[Amikacin_test$Amk == 1 & Amikacin_test$`Amikacin 30` == "R",]$strain

AGly_discrep <- as.data.frame(c(Amk_sens_res, Amk_sens_sens, Amk_res_sens, Amk_res_res))
colnames(AGly_discrep) <- "strain"
AGly_discrep$Amk_sens_res <- 0
AGly_discrep$Amk_sens_sens <- 0
AGly_discrep$Amk_res_res <- 0
AGly_discrep$Amk_res_sens <- 0

AGly_discrep[AGly_discrep$strain %in% Amk_sens_res,]$Amk_sens_res <- 1
AGly_discrep[AGly_discrep$strain %in% Amk_sens_sens,]$Amk_sens_sens <- 1
AGly_discrep[AGly_discrep$strain %in% Amk_res_res,]$Amk_res_res <- 1
AGly_discrep[AGly_discrep$strain %in% Amk_res_sens,]$Amk_res_sens <- 1

all_AGly$strain <- ariba_full_AMR$name
AGly_discrep <- left_join(AGly_discrep, all_AGly)
#> Joining with `by = join_by(strain)`


#Now, going through beta-lactams, ugh....
ariba_AMR_genes <- ariba_AMR
ariba_AMR_genes <- ariba_AMR_genes %>% select_if(colSums(.) != 0)
ariba_Bla_genes <- ariba_AMR_genes %>% select(contains("Bla"))

all_Bla <- ariba_full_AMR %>% select(contains("Bla"))
all_Bla_names <- all_Bla %>% select(contains("ref_seq"))
colnames(all_Bla_names) <- gsub(".ref_seq","",colnames(all_Bla_names))
all_Bla_names <- all_Bla_names[,colnames(ariba_Bla_genes)]

Bla_genes <- lapply(all_Bla_names, unique)

all_Bla_names[ariba_Bla_genes == 0] <- NA

ariba_Bla_genes$ESBL <- ariba_Bla_genes$AmpC2_Ecoli_Bla + ariba_Bla_genes$CMY_Bla + ariba_Bla_genes$CTX_M_1_Bla + ariba_Bla_genes$CTX_M_9_Bla + ariba_Bla_genes$CARB_Bla + ariba_Bla_genes$VEB_1_Bla

#checked through different groups - all except CTX1 are a single gene. VEB is VEB6; CARB is CARB2; CTXM9 is CTX-M-14; CMY is CMY4; AmpC is AmpC2. CTX1 is CTX-M-55 and CTX-M-15 (also 71 and 72 but not properly assembled hence no)

#These IDs have CTX-M-55 in the full table "42070_2#154","42070_2#158","42070_2#179","42070_2#180","42070_2#182","42070_2#18","42070_2#216","42070_2#255","42070_2#315","42070_2#334","42070_2#359"; make a separate column for CTXM55 and remove the CTXM1 hit for them (which is actually CTXM15 for all others)

ariba_Bla_genes$CTX_M_55 <- 0
maybe_55 <- c("42070_2#154","42070_2#158","42070_2#179","42070_2#180","42070_2#182","42070_2#18","42070_2#216","42070_2#255","42070_2#315","42070_2#334","42070_2#359")
ariba_Bla_genes[maybe_55,]$CTX_M_55 <- 1
ariba_Bla_genes[maybe_55,]$CTX_M_1_Bla <- 0

ariba_Bla_genes$strain <- row.names(ariba_Bla_genes)

Bla_time <- left_join(LIMS_kleborate, ariba_Bla_genes, by="strain")

ESBL_gen <- Bla_time[!is.na(Bla_time$DATE) & Bla_time$DATE > 1999,] %>% tidyr::gather("id", "value", c(147, 149, 150, 151, 152, 163, 165)) %>%  group_by(DATE, id) %>% summarise(value = sum(value)) %>%
    ggplot() +
    aes(DATE, value) +
    geom_bar(aes(fill = id), stat="identity") +
    theme(axis.text.x = element_text(angle = 90, hjust = 1)) +
    scale_fill_manual(values=ESBL_col, name = "ESBL genes", labels = c("AmpC2", "CARB", "CMY", "CTX-M-15", "CTX-M-55", "CTX-M-9", "VEB-1")) +
    theme_bw() +
    theme(axis.text.x = element_text(angle = 90, hjust = 1)) +
    xlab("Date") + ylab("Count") +
    ggtitle("ESBL genes over time")
#> `summarise()` has grouped output by 'DATE'. You can override using the
#> `.groups` argument.

ariba_Bla_genes$carb <- ariba_Bla_genes$NDM_1_Bla


#Now, also double checking if the Chlam predictions are correct and how many of the truncated predictions (see Fabrice's paper) of CatB are sensitive

chlam_res <- LIMS_kleborate[LIMS_kleborate$`Chloramphenicol 30` == "R",]$strain
chlam_sens <- LIMS_kleborate[LIMS_kleborate$`Chloramphenicol 30` == "S",]$strain

ariba_AMR$name <- row.names(ariba_AMR)
ChlamRes_CatA12 <- ariba_AMR[ariba_AMR$name %in% chlam_res & ariba_AMR$CatA1_Phe == 1 | ariba_AMR$name %in% chlam_res & ariba_AMR$CatA2_Phe == 1,]$name
ChlamRes_NoCatA12 <- ariba_AMR[ariba_AMR$name %in% chlam_res & ariba_AMR$CatA1_Phe == 0 & ariba_AMR$CatA2_Phe == 0,]$name
ChlamSens_NoCatA12 <- ariba_AMR[ariba_AMR$name %in% chlam_sens & ariba_AMR$CatA1_Phe == 0 & ariba_AMR$CatA2_Phe == 0,]$name
ChlamSens_CatA12 <- ariba_AMR[ariba_AMR$name %in% chlam_sens & ariba_AMR$CatA1_Phe == 1 |ariba_AMR$name %in% chlam_sens & ariba_AMR$CatA2_Phe == 1,]$name
ChlamSens_CatBx <- ariba_AMR[ariba_AMR$name %in% chlam_sens & ariba_AMR$CatBx_Phe == 1,]$name
ChlamRes_CatBx <- ariba_AMR[ariba_AMR$name %in% chlam_res & ariba_AMR$CatBx_Phe == 1,]$name

#These tables are getting really unwieldy, so I'm making a new one

for_chlam <- LIMS_kleborate[!is.na(LIMS_kleborate$`Chloramphenicol 30`), c(1, 3, 102, 125)]
for_chlam$CatA12 <- "no"
for_chlam$CatBx <- "no"
for_chlam[for_chlam$strain %in% ChlamRes_CatA12 | for_chlam$strain %in% ChlamSens_CatA12,]$CatA12 <- "yes"
for_chlam[for_chlam$strain %in% ChlamRes_CatBx | for_chlam$strain %in% ChlamSens_CatBx,]$CatBx <- "yes"

Chlam_res <- ggplot(for_chlam[!is.na(for_chlam$DATE) & for_chlam$`Chloramphenicol 30` != "I",]) + geom_bar(aes(x=DATE, fill=paste(`Chloramphenicol 30`, CatA12, CatBx)), position="fill") + theme_bw() + scale_fill_manual(values=met.brewer("Troy"), name = "Phenotype / CatA1-2 / CatB") + xlab("Date") + ylab("Proportion") + theme(axis.text.x = element_text(angle = 90, hjust = 1)) + ggtitle("Phenotype vs chloramphenicol resistance genes")

(ESBL_gen + Chlam_res) / (Amk_plot + Gent_plot) + plot_annotation(title = "Figure 4", tag_levels = "A", tag_suffix = ")")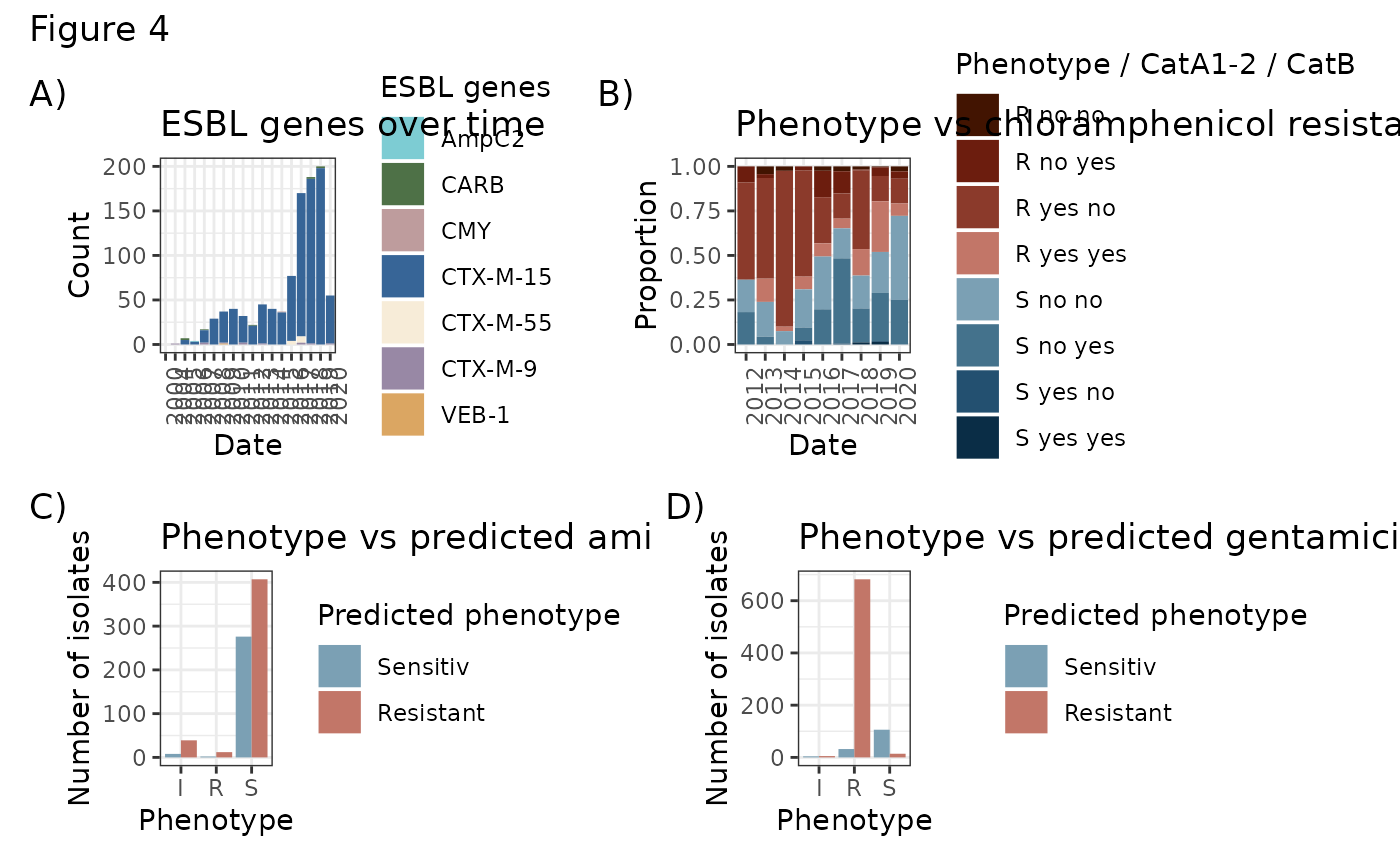
Antimicrobial resistance and virulence over time
Vir_war <- ggplot(LIMS_kleborate[!is.na(LIMS_kleborate$DATE)  & LIMS_kleborate$DATE > 1999 &  LIMS_kleborate$virulence_score > 1,]) + geom_bar(aes(x = DATE, group = major_wards, fill= major_wards)) + theme_bw() + scale_fill_manual(values=ward_col) + theme(axis.text.x = element_text(angle = 90, hjust = 1), legend.position="none") + xlab("Date") + ylab("Number of isolates") + ggtitle("Isolates with virulence score > 1") + ylim(0, 250)

Res_war <- ggplot(data=LIMS_kleborate[!is.na(LIMS_kleborate$DATE) & LIMS_kleborate$DATE > 1999 & LIMS_kleborate$resistance_score > 0,]) + geom_bar(aes(x = DATE, group = major_wards, fill= major_wards)) + theme_bw() + scale_fill_manual(values=ward_col, name="Major wards") + theme(axis.text.x = element_text(angle = 90, hjust = 1)) + xlab("Date") + ylab("Number of isolates") + ggtitle("Isolates with resistance score > 0") + ylim(0, 250) + theme(legend.key.size = unit(0.3, 'cm'))

vir_prop <- ggplot(LIMS_kleborate[!is.na(LIMS_kleborate$DATE) & LIMS_kleborate$DATE > 1999,] %>% group_by(DATE, virulence_score) %>% summarize(n()) %>%
    mutate (VIR = cut (virulence_score,
                       breaks = c(-Inf, 1, Inf),
                       labels = c("low", "high"),
                       right = TRUE))) + geom_bar(aes(x=DATE, y=`n()`, group=VIR, fill=VIR), stat="identity", position="fill")  + theme_bw() + theme(axis.text.x = element_text(angle = 90, hjust = 1), legend.position="none") + scale_fill_manual(values=c("low" = "#aaf0d1", "high" = "#158078")) + xlab("Date") + ylab("Proportion of isolates") + ggtitle("Proportion with virulence score > 1")
#> `summarise()` has grouped output by 'DATE'. You can override using the
#> `.groups` argument.

AMR_prop <- ggplot(LIMS_kleborate[!is.na(LIMS_kleborate$DATE) & LIMS_kleborate$DATE > 1999,] %>% group_by(DATE, resistance_score) %>% summarize(n()) %>%
    mutate (AMR = cut (resistance_score,
                       breaks = c(-Inf, 0, Inf),
                       labels = c("low", "high"),
                       right = TRUE))) + geom_bar(aes(x=DATE, y=`n()`, group=AMR, fill=AMR), stat="identity", position="fill") + theme_bw() + theme(axis.text.x = element_text(angle = 90, hjust = 1), legend.position="none") + scale_fill_manual(values=c("low" = "#fddde6", "high" = "#ca3767")) + xlab("Date") + ylab("Proportion of isolates") + ggtitle("Proportion with resistance score > 0")
#> `summarise()` has grouped output by 'DATE'. You can override using the
#> `.groups` argument.


vir_prop + Vir_war + AMR_prop + Res_war + plot_layout(nrow = 2, ncol = 2) + plot_annotation(title = "Figure S8", tag_levels = "A", tag_suffix = ")") + plot_layout(guides = "collect")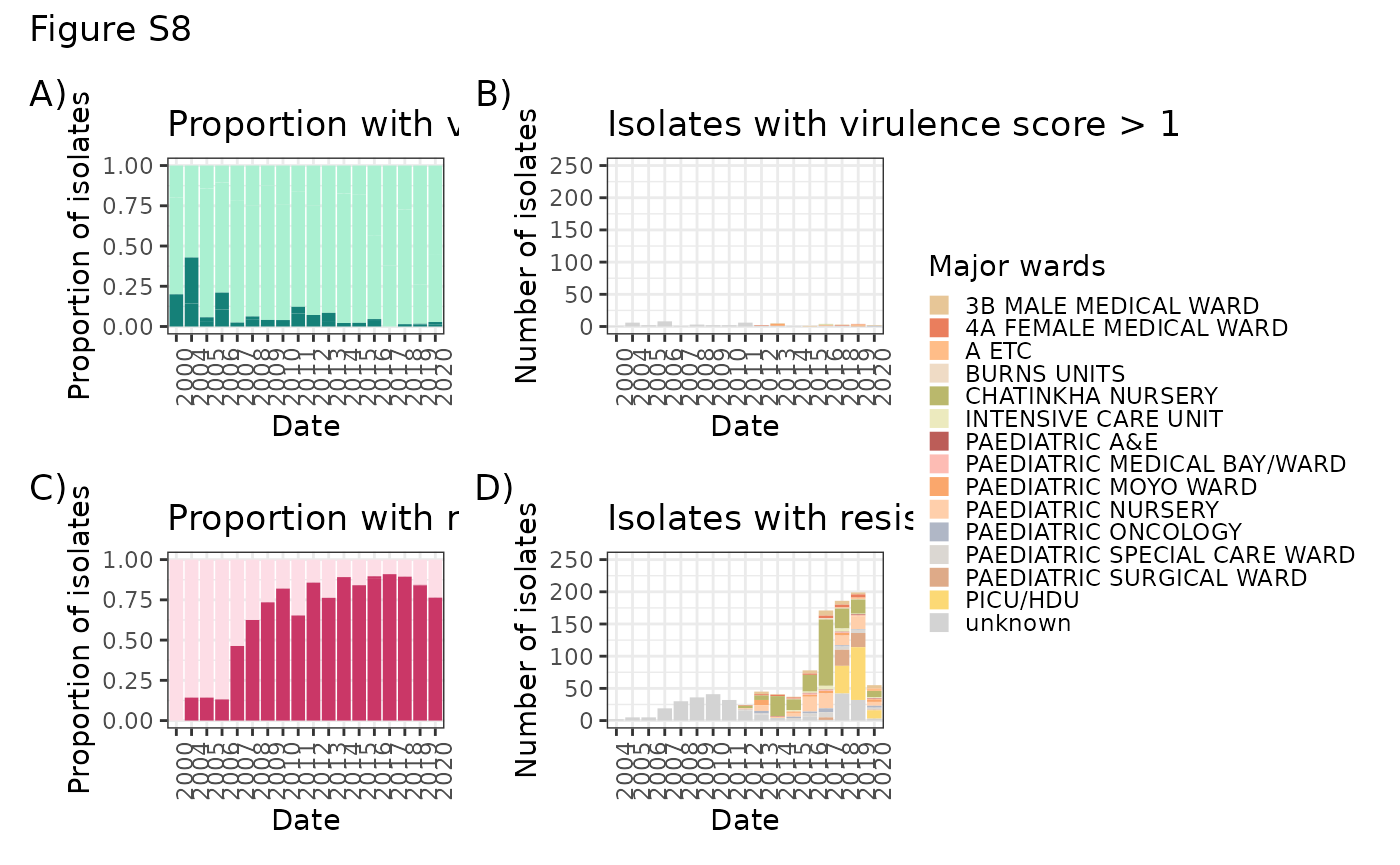
Clustering of closely related isolates, tree visualisations
#Making a small kleborate sub-table to plot parts of the metadata

for_mapping <- LIMS_kleborate[,c(1, 111, 102, 145)]
for_mapping$strain <- gsub('#','_', for_mapping$strain)

for_mapping_DATE <- as.data.frame(for_mapping$DATE)
row.names(for_mapping_DATE) <- for_mapping$strain

for_mapping_ward <- as.data.frame(for_mapping$major_wards)
row.names(for_mapping_ward) <- for_mapping$strain

for_mapping_ST <- as.data.frame(for_mapping$main_ST)
row.names(for_mapping_ST) <- for_mapping$strain


#Fishing out which isolates are in minor or major clusters, and how many of these in neonates

#setwd("~/Nextcloud/Documents/manuscripts/Klebs_Malawi/mapping_refs/no_singles/")

results <- pinecone(Kp2tree, 5, 10, quiet = TRUE)
#> Warning in igraph::graph.dfs(igraph.tree, root = ntips + 1, neimode = "out", :
#> Argument `neimode' is deprecated; use `mode' instead
#> Warning in graph.dfs(igraph.tree, node, neimode = "out", unreachable = FALSE):
#> Argument `neimode' is deprecated; use `mode' instead

#> Warning in graph.dfs(igraph.tree, node, neimode = "out", unreachable = FALSE):
#> Argument `neimode' is deprecated; use `mode' instead

#> Warning in graph.dfs(igraph.tree, node, neimode = "out", unreachable = FALSE):
#> Argument `neimode' is deprecated; use `mode' instead

#> Warning in graph.dfs(igraph.tree, node, neimode = "out", unreachable = FALSE):
#> Argument `neimode' is deprecated; use `mode' instead

#> Warning in graph.dfs(igraph.tree, node, neimode = "out", unreachable = FALSE):
#> Argument `neimode' is deprecated; use `mode' instead

#> Warning in graph.dfs(igraph.tree, node, neimode = "out", unreachable = FALSE):
#> Argument `neimode' is deprecated; use `mode' instead

#> Warning in graph.dfs(igraph.tree, node, neimode = "out", unreachable = FALSE):
#> Argument `neimode' is deprecated; use `mode' instead

#> Warning in graph.dfs(igraph.tree, node, neimode = "out", unreachable = FALSE):
#> Argument `neimode' is deprecated; use `mode' instead

#> Warning in graph.dfs(igraph.tree, node, neimode = "out", unreachable = FALSE):
#> Argument `neimode' is deprecated; use `mode' instead

#> Warning in graph.dfs(igraph.tree, node, neimode = "out", unreachable = FALSE):
#> Argument `neimode' is deprecated; use `mode' instead

#> Warning in graph.dfs(igraph.tree, node, neimode = "out", unreachable = FALSE):
#> Argument `neimode' is deprecated; use `mode' instead

#> Warning in graph.dfs(igraph.tree, node, neimode = "out", unreachable = FALSE):
#> Argument `neimode' is deprecated; use `mode' instead

#> Warning in graph.dfs(igraph.tree, node, neimode = "out", unreachable = FALSE):
#> Argument `neimode' is deprecated; use `mode' instead

#> Warning in graph.dfs(igraph.tree, node, neimode = "out", unreachable = FALSE):
#> Argument `neimode' is deprecated; use `mode' instead

#> Warning in graph.dfs(igraph.tree, node, neimode = "out", unreachable = FALSE):
#> Argument `neimode' is deprecated; use `mode' instead

#> Warning in graph.dfs(igraph.tree, node, neimode = "out", unreachable = FALSE):
#> Argument `neimode' is deprecated; use `mode' instead

#> Warning in graph.dfs(igraph.tree, node, neimode = "out", unreachable = FALSE):
#> Argument `neimode' is deprecated; use `mode' instead

#> Warning in graph.dfs(igraph.tree, node, neimode = "out", unreachable = FALSE):
#> Argument `neimode' is deprecated; use `mode' instead

#> Warning in graph.dfs(igraph.tree, node, neimode = "out", unreachable = FALSE):
#> Argument `neimode' is deprecated; use `mode' instead

#> Warning in graph.dfs(igraph.tree, node, neimode = "out", unreachable = FALSE):
#> Argument `neimode' is deprecated; use `mode' instead

#> Warning in graph.dfs(igraph.tree, node, neimode = "out", unreachable = FALSE):
#> Argument `neimode' is deprecated; use `mode' instead

#> Warning in graph.dfs(igraph.tree, node, neimode = "out", unreachable = FALSE):
#> Argument `neimode' is deprecated; use `mode' instead

#> Warning in graph.dfs(igraph.tree, node, neimode = "out", unreachable = FALSE):
#> Argument `neimode' is deprecated; use `mode' instead

#> Warning in graph.dfs(igraph.tree, node, neimode = "out", unreachable = FALSE):
#> Argument `neimode' is deprecated; use `mode' instead

#> Warning in graph.dfs(igraph.tree, node, neimode = "out", unreachable = FALSE):
#> Argument `neimode' is deprecated; use `mode' instead

#> Warning in graph.dfs(igraph.tree, node, neimode = "out", unreachable = FALSE):
#> Argument `neimode' is deprecated; use `mode' instead

#> Warning in graph.dfs(igraph.tree, node, neimode = "out", unreachable = FALSE):
#> Argument `neimode' is deprecated; use `mode' instead

#> Warning in graph.dfs(igraph.tree, node, neimode = "out", unreachable = FALSE):
#> Argument `neimode' is deprecated; use `mode' instead

#> Warning in graph.dfs(igraph.tree, node, neimode = "out", unreachable = FALSE):
#> Argument `neimode' is deprecated; use `mode' instead

#> Warning in graph.dfs(igraph.tree, node, neimode = "out", unreachable = FALSE):
#> Argument `neimode' is deprecated; use `mode' instead

#> Warning in graph.dfs(igraph.tree, node, neimode = "out", unreachable = FALSE):
#> Argument `neimode' is deprecated; use `mode' instead

#> Warning in graph.dfs(igraph.tree, node, neimode = "out", unreachable = FALSE):
#> Argument `neimode' is deprecated; use `mode' instead

#> Warning in graph.dfs(igraph.tree, node, neimode = "out", unreachable = FALSE):
#> Argument `neimode' is deprecated; use `mode' instead

#> Warning in graph.dfs(igraph.tree, node, neimode = "out", unreachable = FALSE):
#> Argument `neimode' is deprecated; use `mode' instead

#> Warning in graph.dfs(igraph.tree, node, neimode = "out", unreachable = FALSE):
#> Argument `neimode' is deprecated; use `mode' instead

#> Warning in graph.dfs(igraph.tree, node, neimode = "out", unreachable = FALSE):
#> Argument `neimode' is deprecated; use `mode' instead

#> Warning in graph.dfs(igraph.tree, node, neimode = "out", unreachable = FALSE):
#> Argument `neimode' is deprecated; use `mode' instead

#> Warning in graph.dfs(igraph.tree, node, neimode = "out", unreachable = FALSE):
#> Argument `neimode' is deprecated; use `mode' instead

#> Warning in graph.dfs(igraph.tree, node, neimode = "out", unreachable = FALSE):
#> Argument `neimode' is deprecated; use `mode' instead

#> Warning in graph.dfs(igraph.tree, node, neimode = "out", unreachable = FALSE):
#> Argument `neimode' is deprecated; use `mode' instead

#> Warning in graph.dfs(igraph.tree, node, neimode = "out", unreachable = FALSE):
#> Argument `neimode' is deprecated; use `mode' instead

#> Warning in graph.dfs(igraph.tree, node, neimode = "out", unreachable = FALSE):
#> Argument `neimode' is deprecated; use `mode' instead

#> Warning in graph.dfs(igraph.tree, node, neimode = "out", unreachable = FALSE):
#> Argument `neimode' is deprecated; use `mode' instead

#> Warning in graph.dfs(igraph.tree, node, neimode = "out", unreachable = FALSE):
#> Argument `neimode' is deprecated; use `mode' instead

#> Warning in graph.dfs(igraph.tree, node, neimode = "out", unreachable = FALSE):
#> Argument `neimode' is deprecated; use `mode' instead

#> Warning in graph.dfs(igraph.tree, node, neimode = "out", unreachable = FALSE):
#> Argument `neimode' is deprecated; use `mode' instead
lineages <- as.data.frame(results$table)
colnames(lineages) <- c("Taxa", "Sub", "Major")
lineages[grep("singleton",lineages$Sub),]$Sub <- NA
Kp2_tree <- ggtree(Kp2tree) %<+% lineages +  geom_tippoint(aes(color = Sub), show.legend=FALSE, size=0.5)+ scale_color_manual(values=met.brewer("Morgenstern", n=6),na.value=NA) + ggtitle("K. quasipneumoniae")


results <- pinecone(Kp3tree, 5, 10, quiet = TRUE)
#> Warning in igraph::graph.dfs(igraph.tree, root = ntips + 1, neimode = "out", :
#> Argument `neimode' is deprecated; use `mode' instead

#> Warning in igraph::graph.dfs(igraph.tree, root = ntips + 1, neimode = "out", :
#> Argument `neimode' is deprecated; use `mode' instead

#> Warning in igraph::graph.dfs(igraph.tree, root = ntips + 1, neimode = "out", :
#> Argument `neimode' is deprecated; use `mode' instead

#> Warning in igraph::graph.dfs(igraph.tree, root = ntips + 1, neimode = "out", :
#> Argument `neimode' is deprecated; use `mode' instead

#> Warning in igraph::graph.dfs(igraph.tree, root = ntips + 1, neimode = "out", :
#> Argument `neimode' is deprecated; use `mode' instead

#> Warning in igraph::graph.dfs(igraph.tree, root = ntips + 1, neimode = "out", :
#> Argument `neimode' is deprecated; use `mode' instead

#> Warning in igraph::graph.dfs(igraph.tree, root = ntips + 1, neimode = "out", :
#> Argument `neimode' is deprecated; use `mode' instead

#> Warning in igraph::graph.dfs(igraph.tree, root = ntips + 1, neimode = "out", :
#> Argument `neimode' is deprecated; use `mode' instead

#> Warning in igraph::graph.dfs(igraph.tree, root = ntips + 1, neimode = "out", :
#> Argument `neimode' is deprecated; use `mode' instead

#> Warning in igraph::graph.dfs(igraph.tree, root = ntips + 1, neimode = "out", :
#> Argument `neimode' is deprecated; use `mode' instead

#> Warning in igraph::graph.dfs(igraph.tree, root = ntips + 1, neimode = "out", :
#> Argument `neimode' is deprecated; use `mode' instead

#> Warning in igraph::graph.dfs(igraph.tree, root = ntips + 1, neimode = "out", :
#> Argument `neimode' is deprecated; use `mode' instead

#> Warning in igraph::graph.dfs(igraph.tree, root = ntips + 1, neimode = "out", :
#> Argument `neimode' is deprecated; use `mode' instead

#> Warning in igraph::graph.dfs(igraph.tree, root = ntips + 1, neimode = "out", :
#> Argument `neimode' is deprecated; use `mode' instead

#> Warning in igraph::graph.dfs(igraph.tree, root = ntips + 1, neimode = "out", :
#> Argument `neimode' is deprecated; use `mode' instead

#> Warning in igraph::graph.dfs(igraph.tree, root = ntips + 1, neimode = "out", :
#> Argument `neimode' is deprecated; use `mode' instead

#> Warning in igraph::graph.dfs(igraph.tree, root = ntips + 1, neimode = "out", :
#> Argument `neimode' is deprecated; use `mode' instead

#> Warning in igraph::graph.dfs(igraph.tree, root = ntips + 1, neimode = "out", :
#> Argument `neimode' is deprecated; use `mode' instead

#> Warning in igraph::graph.dfs(igraph.tree, root = ntips + 1, neimode = "out", :
#> Argument `neimode' is deprecated; use `mode' instead

#> Warning in igraph::graph.dfs(igraph.tree, root = ntips + 1, neimode = "out", :
#> Argument `neimode' is deprecated; use `mode' instead

#> Warning in igraph::graph.dfs(igraph.tree, root = ntips + 1, neimode = "out", :
#> Argument `neimode' is deprecated; use `mode' instead

#> Warning in igraph::graph.dfs(igraph.tree, root = ntips + 1, neimode = "out", :
#> Argument `neimode' is deprecated; use `mode' instead

#> Warning in igraph::graph.dfs(igraph.tree, root = ntips + 1, neimode = "out", :
#> Argument `neimode' is deprecated; use `mode' instead

#> Warning in igraph::graph.dfs(igraph.tree, root = ntips + 1, neimode = "out", :
#> Argument `neimode' is deprecated; use `mode' instead

#> Warning in igraph::graph.dfs(igraph.tree, root = ntips + 1, neimode = "out", :
#> Argument `neimode' is deprecated; use `mode' instead

#> Warning in igraph::graph.dfs(igraph.tree, root = ntips + 1, neimode = "out", :
#> Argument `neimode' is deprecated; use `mode' instead

#> Warning in igraph::graph.dfs(igraph.tree, root = ntips + 1, neimode = "out", :
#> Argument `neimode' is deprecated; use `mode' instead

#> Warning in igraph::graph.dfs(igraph.tree, root = ntips + 1, neimode = "out", :
#> Argument `neimode' is deprecated; use `mode' instead

#> Warning in igraph::graph.dfs(igraph.tree, root = ntips + 1, neimode = "out", :
#> Argument `neimode' is deprecated; use `mode' instead

#> Warning in igraph::graph.dfs(igraph.tree, root = ntips + 1, neimode = "out", :
#> Argument `neimode' is deprecated; use `mode' instead

#> Warning in igraph::graph.dfs(igraph.tree, root = ntips + 1, neimode = "out", :
#> Argument `neimode' is deprecated; use `mode' instead

#> Warning in igraph::graph.dfs(igraph.tree, root = ntips + 1, neimode = "out", :
#> Argument `neimode' is deprecated; use `mode' instead

#> Warning in igraph::graph.dfs(igraph.tree, root = ntips + 1, neimode = "out", :
#> Argument `neimode' is deprecated; use `mode' instead

#> Warning in igraph::graph.dfs(igraph.tree, root = ntips + 1, neimode = "out", :
#> Argument `neimode' is deprecated; use `mode' instead

#> Warning in igraph::graph.dfs(igraph.tree, root = ntips + 1, neimode = "out", :
#> Argument `neimode' is deprecated; use `mode' instead

#> Warning in igraph::graph.dfs(igraph.tree, root = ntips + 1, neimode = "out", :
#> Argument `neimode' is deprecated; use `mode' instead

#> Warning in igraph::graph.dfs(igraph.tree, root = ntips + 1, neimode = "out", :
#> Argument `neimode' is deprecated; use `mode' instead

#> Warning in igraph::graph.dfs(igraph.tree, root = ntips + 1, neimode = "out", :
#> Argument `neimode' is deprecated; use `mode' instead

#> Warning in igraph::graph.dfs(igraph.tree, root = ntips + 1, neimode = "out", :
#> Argument `neimode' is deprecated; use `mode' instead

#> Warning in igraph::graph.dfs(igraph.tree, root = ntips + 1, neimode = "out", :
#> Argument `neimode' is deprecated; use `mode' instead

#> Warning in igraph::graph.dfs(igraph.tree, root = ntips + 1, neimode = "out", :
#> Argument `neimode' is deprecated; use `mode' instead
lineages <- as.data.frame(results$table)
colnames(lineages) <- c("Taxa", "Sub", "Major")
#lineages[grep("singleton",lineages$Sub),]$singletons
lineages[grep("singleton",lineages$Sub),]$Sub <- NA
Kp3_tree <- ggtree(Kp3tree) %<+% lineages +  geom_tippoint(aes(color = Sub), show.legend=FALSE, size=0.5)+ scale_color_manual(values=met.brewer("Morgenstern", n=4),na.value=NA) + ggtitle("K. variicola")


get_mrca_of_set(Kp1tree, for_mapping[for_mapping$main_ST == "ST39",]$strain)
#> [1] 1646
get_mrca_of_set(Kp1tree, for_mapping[for_mapping$main_ST == "ST35",]$strain)
#> [1] 2168
get_mrca_of_set(Kp1tree, for_mapping[for_mapping$main_ST == "ST14",]$strain)
#> [1] 1854
get_mrca_of_set(Kp1tree, for_mapping[for_mapping$main_ST == "ST15",]$strain)
#> [1] 2047
get_mrca_of_set(Kp1tree, for_mapping[for_mapping$main_ST == "ST307",]$strain)
#> [1] 1392
get_mrca_of_set(Kp1tree, for_mapping[for_mapping$main_ST == "ST101",]$strain)
#> [1] 2230
get_mrca_of_set(Kp1tree, for_mapping[for_mapping$main_ST == "ST340",]$strain)
#> [1] 1204

Fig3 <- ggtree(Kp1tree, layout="circular") +
    geom_cladelab(node=1646, label="ST39", horizontal=FALSE, angle="auto", vjust=1, hjust=0.5, barcolour="#995556", textcolour="#995556") +
    geom_cladelab(node=2168, label="ST35", horizontal=FALSE, angle="auto", barcolour="#B15232", textcolour="#B15232", hjust=0.5, vjust=-0.2) +
    geom_cladelab(node=1854, label="ST14", horizontal=FALSE, angle="auto", vjust=-0.2, barcolour="#395B7B", textcolour="#395B7B") +
    geom_cladelab(node=2047, label="ST15", horizontal=FALSE, angle="auto", vjust=-0.2, hjust=0.5, barcolour="#26405D", textcolour="#26405D") +
    geom_cladelab(node=1204, label="ST340", horizontal=FALSE, angle="auto", vjust=1, hjust=0.5, barcolour="#CB7456", textcolour="#CB7456") +
    geom_cladelab(node= 1392, label="ST307", horizontal=FALSE, angle="auto", vjust=1, hjust=0.5, barcolour="#C2856A", textcolour="#C2856A") +
    geom_cladelab(node=2230, label="ST101", horizontal=FALSE, angle="auto", barcolour="#5B859E", textcolour="#5B859E", hjust=0.3, vjust=-0.2)

#results <- pinecone(Kp1tree, 5, 10, quiet = TRUE)
#lineages <- as.data.frame(results$table)
#colnames(lineages) <- c("Taxa", "Sub", "Major")
#lineages[grep("singleton",lineages$Sub),]$singletons
#lineages[grep("singleton",lineages$Sub),]$Sub <- NA
#Kp1_tree <- Fig3 %<+% lineages +  geom_tippoint(aes(color = Sub), show.legend=FALSE, size=0.4) + scale_color_manual(values=met.brewer("Morgenstern", n=155), na.value=NA) + ggtitle("K. pneumoniae subsp. pneumoniae")


results <- pinecone(ST1415tree, 5, 10, quiet = TRUE)
#> Warning in igraph::graph.dfs(igraph.tree, root = ntips + 1, neimode = "out", :
#> Argument `neimode' is deprecated; use `mode' instead

#> Warning in igraph::graph.dfs(igraph.tree, root = ntips + 1, neimode = "out", :
#> Argument `neimode' is deprecated; use `mode' instead

#> Warning in igraph::graph.dfs(igraph.tree, root = ntips + 1, neimode = "out", :
#> Argument `neimode' is deprecated; use `mode' instead

#> Warning in igraph::graph.dfs(igraph.tree, root = ntips + 1, neimode = "out", :
#> Argument `neimode' is deprecated; use `mode' instead

#> Warning in igraph::graph.dfs(igraph.tree, root = ntips + 1, neimode = "out", :
#> Argument `neimode' is deprecated; use `mode' instead

#> Warning in igraph::graph.dfs(igraph.tree, root = ntips + 1, neimode = "out", :
#> Argument `neimode' is deprecated; use `mode' instead

#> Warning in igraph::graph.dfs(igraph.tree, root = ntips + 1, neimode = "out", :
#> Argument `neimode' is deprecated; use `mode' instead

#> Warning in igraph::graph.dfs(igraph.tree, root = ntips + 1, neimode = "out", :
#> Argument `neimode' is deprecated; use `mode' instead

#> Warning in igraph::graph.dfs(igraph.tree, root = ntips + 1, neimode = "out", :
#> Argument `neimode' is deprecated; use `mode' instead

#> Warning in igraph::graph.dfs(igraph.tree, root = ntips + 1, neimode = "out", :
#> Argument `neimode' is deprecated; use `mode' instead

#> Warning in igraph::graph.dfs(igraph.tree, root = ntips + 1, neimode = "out", :
#> Argument `neimode' is deprecated; use `mode' instead

#> Warning in igraph::graph.dfs(igraph.tree, root = ntips + 1, neimode = "out", :
#> Argument `neimode' is deprecated; use `mode' instead

#> Warning in igraph::graph.dfs(igraph.tree, root = ntips + 1, neimode = "out", :
#> Argument `neimode' is deprecated; use `mode' instead

#> Warning in igraph::graph.dfs(igraph.tree, root = ntips + 1, neimode = "out", :
#> Argument `neimode' is deprecated; use `mode' instead

#> Warning in igraph::graph.dfs(igraph.tree, root = ntips + 1, neimode = "out", :
#> Argument `neimode' is deprecated; use `mode' instead

#> Warning in igraph::graph.dfs(igraph.tree, root = ntips + 1, neimode = "out", :
#> Argument `neimode' is deprecated; use `mode' instead

#> Warning in igraph::graph.dfs(igraph.tree, root = ntips + 1, neimode = "out", :
#> Argument `neimode' is deprecated; use `mode' instead

#> Warning in igraph::graph.dfs(igraph.tree, root = ntips + 1, neimode = "out", :
#> Argument `neimode' is deprecated; use `mode' instead

#> Warning in igraph::graph.dfs(igraph.tree, root = ntips + 1, neimode = "out", :
#> Argument `neimode' is deprecated; use `mode' instead

#> Warning in igraph::graph.dfs(igraph.tree, root = ntips + 1, neimode = "out", :
#> Argument `neimode' is deprecated; use `mode' instead

#> Warning in igraph::graph.dfs(igraph.tree, root = ntips + 1, neimode = "out", :
#> Argument `neimode' is deprecated; use `mode' instead

#> Warning in igraph::graph.dfs(igraph.tree, root = ntips + 1, neimode = "out", :
#> Argument `neimode' is deprecated; use `mode' instead

#> Warning in igraph::graph.dfs(igraph.tree, root = ntips + 1, neimode = "out", :
#> Argument `neimode' is deprecated; use `mode' instead

#> Warning in igraph::graph.dfs(igraph.tree, root = ntips + 1, neimode = "out", :
#> Argument `neimode' is deprecated; use `mode' instead

#> Warning in igraph::graph.dfs(igraph.tree, root = ntips + 1, neimode = "out", :
#> Argument `neimode' is deprecated; use `mode' instead

#> Warning in igraph::graph.dfs(igraph.tree, root = ntips + 1, neimode = "out", :
#> Argument `neimode' is deprecated; use `mode' instead

#> Warning in igraph::graph.dfs(igraph.tree, root = ntips + 1, neimode = "out", :
#> Argument `neimode' is deprecated; use `mode' instead

#> Warning in igraph::graph.dfs(igraph.tree, root = ntips + 1, neimode = "out", :
#> Argument `neimode' is deprecated; use `mode' instead

#> Warning in igraph::graph.dfs(igraph.tree, root = ntips + 1, neimode = "out", :
#> Argument `neimode' is deprecated; use `mode' instead

#> Warning in igraph::graph.dfs(igraph.tree, root = ntips + 1, neimode = "out", :
#> Argument `neimode' is deprecated; use `mode' instead

#> Warning in igraph::graph.dfs(igraph.tree, root = ntips + 1, neimode = "out", :
#> Argument `neimode' is deprecated; use `mode' instead

#> Warning in igraph::graph.dfs(igraph.tree, root = ntips + 1, neimode = "out", :
#> Argument `neimode' is deprecated; use `mode' instead

#> Warning in igraph::graph.dfs(igraph.tree, root = ntips + 1, neimode = "out", :
#> Argument `neimode' is deprecated; use `mode' instead

#> Warning in igraph::graph.dfs(igraph.tree, root = ntips + 1, neimode = "out", :
#> Argument `neimode' is deprecated; use `mode' instead

#> Warning in igraph::graph.dfs(igraph.tree, root = ntips + 1, neimode = "out", :
#> Argument `neimode' is deprecated; use `mode' instead

#> Warning in igraph::graph.dfs(igraph.tree, root = ntips + 1, neimode = "out", :
#> Argument `neimode' is deprecated; use `mode' instead

#> Warning in igraph::graph.dfs(igraph.tree, root = ntips + 1, neimode = "out", :
#> Argument `neimode' is deprecated; use `mode' instead

#> Warning in igraph::graph.dfs(igraph.tree, root = ntips + 1, neimode = "out", :
#> Argument `neimode' is deprecated; use `mode' instead

#> Warning in igraph::graph.dfs(igraph.tree, root = ntips + 1, neimode = "out", :
#> Argument `neimode' is deprecated; use `mode' instead

#> Warning in igraph::graph.dfs(igraph.tree, root = ntips + 1, neimode = "out", :
#> Argument `neimode' is deprecated; use `mode' instead

#> Warning in igraph::graph.dfs(igraph.tree, root = ntips + 1, neimode = "out", :
#> Argument `neimode' is deprecated; use `mode' instead

#> Warning in igraph::graph.dfs(igraph.tree, root = ntips + 1, neimode = "out", :
#> Argument `neimode' is deprecated; use `mode' instead

#> Warning in igraph::graph.dfs(igraph.tree, root = ntips + 1, neimode = "out", :
#> Argument `neimode' is deprecated; use `mode' instead

#> Warning in igraph::graph.dfs(igraph.tree, root = ntips + 1, neimode = "out", :
#> Argument `neimode' is deprecated; use `mode' instead

#> Warning in igraph::graph.dfs(igraph.tree, root = ntips + 1, neimode = "out", :
#> Argument `neimode' is deprecated; use `mode' instead

#> Warning in igraph::graph.dfs(igraph.tree, root = ntips + 1, neimode = "out", :
#> Argument `neimode' is deprecated; use `mode' instead

#> Warning in igraph::graph.dfs(igraph.tree, root = ntips + 1, neimode = "out", :
#> Argument `neimode' is deprecated; use `mode' instead

#> Warning in igraph::graph.dfs(igraph.tree, root = ntips + 1, neimode = "out", :
#> Argument `neimode' is deprecated; use `mode' instead

#> Warning in igraph::graph.dfs(igraph.tree, root = ntips + 1, neimode = "out", :
#> Argument `neimode' is deprecated; use `mode' instead

#> Warning in igraph::graph.dfs(igraph.tree, root = ntips + 1, neimode = "out", :
#> Argument `neimode' is deprecated; use `mode' instead

#> Warning in igraph::graph.dfs(igraph.tree, root = ntips + 1, neimode = "out", :
#> Argument `neimode' is deprecated; use `mode' instead

#> Warning in igraph::graph.dfs(igraph.tree, root = ntips + 1, neimode = "out", :
#> Argument `neimode' is deprecated; use `mode' instead

#> Warning in igraph::graph.dfs(igraph.tree, root = ntips + 1, neimode = "out", :
#> Argument `neimode' is deprecated; use `mode' instead

#> Warning in igraph::graph.dfs(igraph.tree, root = ntips + 1, neimode = "out", :
#> Argument `neimode' is deprecated; use `mode' instead

#> Warning in igraph::graph.dfs(igraph.tree, root = ntips + 1, neimode = "out", :
#> Argument `neimode' is deprecated; use `mode' instead

#> Warning in igraph::graph.dfs(igraph.tree, root = ntips + 1, neimode = "out", :
#> Argument `neimode' is deprecated; use `mode' instead

#> Warning in igraph::graph.dfs(igraph.tree, root = ntips + 1, neimode = "out", :
#> Argument `neimode' is deprecated; use `mode' instead

#> Warning in igraph::graph.dfs(igraph.tree, root = ntips + 1, neimode = "out", :
#> Argument `neimode' is deprecated; use `mode' instead

#> Warning in igraph::graph.dfs(igraph.tree, root = ntips + 1, neimode = "out", :
#> Argument `neimode' is deprecated; use `mode' instead

#> Warning in igraph::graph.dfs(igraph.tree, root = ntips + 1, neimode = "out", :
#> Argument `neimode' is deprecated; use `mode' instead

#> Warning in igraph::graph.dfs(igraph.tree, root = ntips + 1, neimode = "out", :
#> Argument `neimode' is deprecated; use `mode' instead

#> Warning in igraph::graph.dfs(igraph.tree, root = ntips + 1, neimode = "out", :
#> Argument `neimode' is deprecated; use `mode' instead

#> Warning in igraph::graph.dfs(igraph.tree, root = ntips + 1, neimode = "out", :
#> Argument `neimode' is deprecated; use `mode' instead

#> Warning in igraph::graph.dfs(igraph.tree, root = ntips + 1, neimode = "out", :
#> Argument `neimode' is deprecated; use `mode' instead

#> Warning in igraph::graph.dfs(igraph.tree, root = ntips + 1, neimode = "out", :
#> Argument `neimode' is deprecated; use `mode' instead

#> Warning in igraph::graph.dfs(igraph.tree, root = ntips + 1, neimode = "out", :
#> Argument `neimode' is deprecated; use `mode' instead

#> Warning in igraph::graph.dfs(igraph.tree, root = ntips + 1, neimode = "out", :
#> Argument `neimode' is deprecated; use `mode' instead

#> Warning in igraph::graph.dfs(igraph.tree, root = ntips + 1, neimode = "out", :
#> Argument `neimode' is deprecated; use `mode' instead

#> Warning in igraph::graph.dfs(igraph.tree, root = ntips + 1, neimode = "out", :
#> Argument `neimode' is deprecated; use `mode' instead

#> Warning in igraph::graph.dfs(igraph.tree, root = ntips + 1, neimode = "out", :
#> Argument `neimode' is deprecated; use `mode' instead

#> Warning in igraph::graph.dfs(igraph.tree, root = ntips + 1, neimode = "out", :
#> Argument `neimode' is deprecated; use `mode' instead

#> Warning in igraph::graph.dfs(igraph.tree, root = ntips + 1, neimode = "out", :
#> Argument `neimode' is deprecated; use `mode' instead

#> Warning in igraph::graph.dfs(igraph.tree, root = ntips + 1, neimode = "out", :
#> Argument `neimode' is deprecated; use `mode' instead

#> Warning in igraph::graph.dfs(igraph.tree, root = ntips + 1, neimode = "out", :
#> Argument `neimode' is deprecated; use `mode' instead

#> Warning in igraph::graph.dfs(igraph.tree, root = ntips + 1, neimode = "out", :
#> Argument `neimode' is deprecated; use `mode' instead

#> Warning in igraph::graph.dfs(igraph.tree, root = ntips + 1, neimode = "out", :
#> Argument `neimode' is deprecated; use `mode' instead

#> Warning in igraph::graph.dfs(igraph.tree, root = ntips + 1, neimode = "out", :
#> Argument `neimode' is deprecated; use `mode' instead

#> Warning in igraph::graph.dfs(igraph.tree, root = ntips + 1, neimode = "out", :
#> Argument `neimode' is deprecated; use `mode' instead

#> Warning in igraph::graph.dfs(igraph.tree, root = ntips + 1, neimode = "out", :
#> Argument `neimode' is deprecated; use `mode' instead

#> Warning in igraph::graph.dfs(igraph.tree, root = ntips + 1, neimode = "out", :
#> Argument `neimode' is deprecated; use `mode' instead

#> Warning in igraph::graph.dfs(igraph.tree, root = ntips + 1, neimode = "out", :
#> Argument `neimode' is deprecated; use `mode' instead

#> Warning in igraph::graph.dfs(igraph.tree, root = ntips + 1, neimode = "out", :
#> Argument `neimode' is deprecated; use `mode' instead

#> Warning in igraph::graph.dfs(igraph.tree, root = ntips + 1, neimode = "out", :
#> Argument `neimode' is deprecated; use `mode' instead

#> Warning in igraph::graph.dfs(igraph.tree, root = ntips + 1, neimode = "out", :
#> Argument `neimode' is deprecated; use `mode' instead

#> Warning in igraph::graph.dfs(igraph.tree, root = ntips + 1, neimode = "out", :
#> Argument `neimode' is deprecated; use `mode' instead

#> Warning in igraph::graph.dfs(igraph.tree, root = ntips + 1, neimode = "out", :
#> Argument `neimode' is deprecated; use `mode' instead

#> Warning in igraph::graph.dfs(igraph.tree, root = ntips + 1, neimode = "out", :
#> Argument `neimode' is deprecated; use `mode' instead

#> Warning in igraph::graph.dfs(igraph.tree, root = ntips + 1, neimode = "out", :
#> Argument `neimode' is deprecated; use `mode' instead

#> Warning in igraph::graph.dfs(igraph.tree, root = ntips + 1, neimode = "out", :
#> Argument `neimode' is deprecated; use `mode' instead

#> Warning in igraph::graph.dfs(igraph.tree, root = ntips + 1, neimode = "out", :
#> Argument `neimode' is deprecated; use `mode' instead

#> Warning in igraph::graph.dfs(igraph.tree, root = ntips + 1, neimode = "out", :
#> Argument `neimode' is deprecated; use `mode' instead

#> Warning in igraph::graph.dfs(igraph.tree, root = ntips + 1, neimode = "out", :
#> Argument `neimode' is deprecated; use `mode' instead

#> Warning in igraph::graph.dfs(igraph.tree, root = ntips + 1, neimode = "out", :
#> Argument `neimode' is deprecated; use `mode' instead

#> Warning in igraph::graph.dfs(igraph.tree, root = ntips + 1, neimode = "out", :
#> Argument `neimode' is deprecated; use `mode' instead

#> Warning in igraph::graph.dfs(igraph.tree, root = ntips + 1, neimode = "out", :
#> Argument `neimode' is deprecated; use `mode' instead

#> Warning in igraph::graph.dfs(igraph.tree, root = ntips + 1, neimode = "out", :
#> Argument `neimode' is deprecated; use `mode' instead
lineages <- as.data.frame(results$table)
colnames(lineages) <- c("Taxa", "Sub", "Major")
lineages[grep("singleton",lineages$Sub),]$singletons
#> NULL
lineages[grep("singleton",lineages$Sub),]$Sub <- NA
ST1415_tree <- ggtree(ST1415tree) %<+% lineages +  geom_tippoint(aes(color = Sub), show.legend=FALSE, size=0.5) + scale_color_manual(values=met.brewer("Morgenstern", n=32),na.value=NA)

results <- pinecone(ST35tree, 5, 10, quiet = TRUE)
#> Warning in igraph::graph.dfs(igraph.tree, root = ntips + 1, neimode = "out", :
#> Argument `neimode' is deprecated; use `mode' instead

#> Warning in igraph::graph.dfs(igraph.tree, root = ntips + 1, neimode = "out", :
#> Argument `neimode' is deprecated; use `mode' instead

#> Warning in igraph::graph.dfs(igraph.tree, root = ntips + 1, neimode = "out", :
#> Argument `neimode' is deprecated; use `mode' instead

#> Warning in igraph::graph.dfs(igraph.tree, root = ntips + 1, neimode = "out", :
#> Argument `neimode' is deprecated; use `mode' instead

#> Warning in igraph::graph.dfs(igraph.tree, root = ntips + 1, neimode = "out", :
#> Argument `neimode' is deprecated; use `mode' instead

#> Warning in igraph::graph.dfs(igraph.tree, root = ntips + 1, neimode = "out", :
#> Argument `neimode' is deprecated; use `mode' instead

#> Warning in igraph::graph.dfs(igraph.tree, root = ntips + 1, neimode = "out", :
#> Argument `neimode' is deprecated; use `mode' instead

#> Warning in igraph::graph.dfs(igraph.tree, root = ntips + 1, neimode = "out", :
#> Argument `neimode' is deprecated; use `mode' instead

#> Warning in igraph::graph.dfs(igraph.tree, root = ntips + 1, neimode = "out", :
#> Argument `neimode' is deprecated; use `mode' instead

#> Warning in igraph::graph.dfs(igraph.tree, root = ntips + 1, neimode = "out", :
#> Argument `neimode' is deprecated; use `mode' instead

#> Warning in igraph::graph.dfs(igraph.tree, root = ntips + 1, neimode = "out", :
#> Argument `neimode' is deprecated; use `mode' instead

#> Warning in igraph::graph.dfs(igraph.tree, root = ntips + 1, neimode = "out", :
#> Argument `neimode' is deprecated; use `mode' instead

#> Warning in igraph::graph.dfs(igraph.tree, root = ntips + 1, neimode = "out", :
#> Argument `neimode' is deprecated; use `mode' instead

#> Warning in igraph::graph.dfs(igraph.tree, root = ntips + 1, neimode = "out", :
#> Argument `neimode' is deprecated; use `mode' instead
lineages <- as.data.frame(results$table)
colnames(lineages) <- c("Taxa", "Sub", "Major")
lineages[grep("singleton",lineages$Sub),]$singletons
#> NULL
lineages[grep("singleton",lineages$Sub),]$Sub <- NA
ST35_tree <- ggtree(ST35tree) %<+% lineages +  geom_tippoint(aes(color = Sub), show.legend=FALSE, size=0.5) + scale_color_manual(values=met.brewer("Morgenstern", n=6), na.value=NA)

results <- pinecone(ST39tree, 5, 10, quiet = TRUE)
#> Warning in igraph::graph.dfs(igraph.tree, root = ntips + 1, neimode = "out", :
#> Argument `neimode' is deprecated; use `mode' instead

#> Warning in igraph::graph.dfs(igraph.tree, root = ntips + 1, neimode = "out", :
#> Argument `neimode' is deprecated; use `mode' instead

#> Warning in igraph::graph.dfs(igraph.tree, root = ntips + 1, neimode = "out", :
#> Argument `neimode' is deprecated; use `mode' instead

#> Warning in igraph::graph.dfs(igraph.tree, root = ntips + 1, neimode = "out", :
#> Argument `neimode' is deprecated; use `mode' instead

#> Warning in igraph::graph.dfs(igraph.tree, root = ntips + 1, neimode = "out", :
#> Argument `neimode' is deprecated; use `mode' instead

#> Warning in igraph::graph.dfs(igraph.tree, root = ntips + 1, neimode = "out", :
#> Argument `neimode' is deprecated; use `mode' instead

#> Warning in igraph::graph.dfs(igraph.tree, root = ntips + 1, neimode = "out", :
#> Argument `neimode' is deprecated; use `mode' instead

#> Warning in igraph::graph.dfs(igraph.tree, root = ntips + 1, neimode = "out", :
#> Argument `neimode' is deprecated; use `mode' instead

#> Warning in igraph::graph.dfs(igraph.tree, root = ntips + 1, neimode = "out", :
#> Argument `neimode' is deprecated; use `mode' instead

#> Warning in igraph::graph.dfs(igraph.tree, root = ntips + 1, neimode = "out", :
#> Argument `neimode' is deprecated; use `mode' instead

#> Warning in igraph::graph.dfs(igraph.tree, root = ntips + 1, neimode = "out", :
#> Argument `neimode' is deprecated; use `mode' instead

#> Warning in igraph::graph.dfs(igraph.tree, root = ntips + 1, neimode = "out", :
#> Argument `neimode' is deprecated; use `mode' instead

#> Warning in igraph::graph.dfs(igraph.tree, root = ntips + 1, neimode = "out", :
#> Argument `neimode' is deprecated; use `mode' instead

#> Warning in igraph::graph.dfs(igraph.tree, root = ntips + 1, neimode = "out", :
#> Argument `neimode' is deprecated; use `mode' instead

#> Warning in igraph::graph.dfs(igraph.tree, root = ntips + 1, neimode = "out", :
#> Argument `neimode' is deprecated; use `mode' instead

#> Warning in igraph::graph.dfs(igraph.tree, root = ntips + 1, neimode = "out", :
#> Argument `neimode' is deprecated; use `mode' instead

#> Warning in igraph::graph.dfs(igraph.tree, root = ntips + 1, neimode = "out", :
#> Argument `neimode' is deprecated; use `mode' instead

#> Warning in igraph::graph.dfs(igraph.tree, root = ntips + 1, neimode = "out", :
#> Argument `neimode' is deprecated; use `mode' instead

#> Warning in igraph::graph.dfs(igraph.tree, root = ntips + 1, neimode = "out", :
#> Argument `neimode' is deprecated; use `mode' instead

#> Warning in igraph::graph.dfs(igraph.tree, root = ntips + 1, neimode = "out", :
#> Argument `neimode' is deprecated; use `mode' instead

#> Warning in igraph::graph.dfs(igraph.tree, root = ntips + 1, neimode = "out", :
#> Argument `neimode' is deprecated; use `mode' instead

#> Warning in igraph::graph.dfs(igraph.tree, root = ntips + 1, neimode = "out", :
#> Argument `neimode' is deprecated; use `mode' instead

#> Warning in igraph::graph.dfs(igraph.tree, root = ntips + 1, neimode = "out", :
#> Argument `neimode' is deprecated; use `mode' instead

#> Warning in igraph::graph.dfs(igraph.tree, root = ntips + 1, neimode = "out", :
#> Argument `neimode' is deprecated; use `mode' instead

#> Warning in igraph::graph.dfs(igraph.tree, root = ntips + 1, neimode = "out", :
#> Argument `neimode' is deprecated; use `mode' instead

#> Warning in igraph::graph.dfs(igraph.tree, root = ntips + 1, neimode = "out", :
#> Argument `neimode' is deprecated; use `mode' instead

#> Warning in igraph::graph.dfs(igraph.tree, root = ntips + 1, neimode = "out", :
#> Argument `neimode' is deprecated; use `mode' instead

#> Warning in igraph::graph.dfs(igraph.tree, root = ntips + 1, neimode = "out", :
#> Argument `neimode' is deprecated; use `mode' instead

#> Warning in igraph::graph.dfs(igraph.tree, root = ntips + 1, neimode = "out", :
#> Argument `neimode' is deprecated; use `mode' instead

#> Warning in igraph::graph.dfs(igraph.tree, root = ntips + 1, neimode = "out", :
#> Argument `neimode' is deprecated; use `mode' instead
lineages <- as.data.frame(results$table)
colnames(lineages) <- c("Taxa", "Sub", "Major")
lineages[grep("singleton",lineages$Sub),]$singletons
#> NULL
lineages[grep("singleton",lineages$Sub),]$Sub <- NA
ST39_tree <- ggtree(ST39tree) %<+% lineages +  geom_tippoint(aes(color = Sub), show.legend=FALSE, size=0.5) + scale_color_manual(values=met.brewer("Morgenstern", n=13), na.value=NA)


ST1415_tree_1 <- gheatmap(ST1415_tree, for_mapping_DATE, colnames=FALSE, width = 0.04, offset = 15, colnames_offset_y = 10) + scale_fill_manual(values=date_col) + theme(legend.position = 'none')
#> Scale for y is already present.
#> Adding another scale for y, which will replace the existing scale.
#> Scale for fill is already present.
#> Adding another scale for fill, which will replace the existing scale.

ST1415_tree_2 <- gheatmap(ST1415_tree_1, for_mapping_ward, colnames=FALSE, width = 0.04, offset = 120, colnames_offset_y = 10) + scale_fill_manual(values=c(date_col,ward_col)) + theme(legend.position = 'none') + ggtitle("ST14 & ST15")
#> Scale for fill is already present.
#> Adding another scale for fill, which will replace the existing scale.
#> Scale for y is already present.
#> Adding another scale for y, which will replace the existing scale.
#> Scale for fill is already present.
#> Adding another scale for fill, which will replace the existing scale.

ST35_tree_1 <- gheatmap(ST35_tree, for_mapping_DATE, colnames=FALSE, width = 0.04, offset = 8, colnames_offset_y = 10) + scale_fill_manual(values=date_col) + theme(legend.position = 'none')
#> Scale for y is already present.
#> Adding another scale for y, which will replace the existing scale.
#> Scale for fill is already present.
#> Adding another scale for fill, which will replace the existing scale.

ST35_tree_2 <- gheatmap(ST35_tree_1, for_mapping_ward, colnames=FALSE, width = 0.04, offset = 24, colnames_offset_y = 10) + scale_fill_manual(values=c(date_col,ward_col)) + theme(legend.position = 'none') + ggtitle("ST35")
#> Scale for fill is already present.
#> Adding another scale for fill, which will replace the existing scale.
#> Scale for y is already present.
#> Adding another scale for y, which will replace the existing scale.
#> Scale for fill is already present.
#> Adding another scale for fill, which will replace the existing scale.

ST39_tree_1 <- gheatmap(ST39_tree, for_mapping_DATE, colnames=FALSE, width = 0.04, offset = 5, colnames_offset_y = 10) + scale_fill_manual(values=date_col) + theme(legend.position = 'none')
#> Scale for y is already present.
#> Adding another scale for y, which will replace the existing scale.
#> Scale for fill is already present.
#> Adding another scale for fill, which will replace the existing scale.

ST39_tree_2 <- gheatmap(ST39_tree_1, for_mapping_ward, colnames=FALSE, width = 0.04, offset = 12, colnames_offset_y = 10) + scale_fill_manual(values=c(date_col,ward_col)) + theme(legend.position = 'none') + ggtitle("ST39")
#> Scale for fill is already present.
#> Adding another scale for fill, which will replace the existing scale.
#> Scale for y is already present.
#> Adding another scale for y, which will replace the existing scale.
#> Scale for fill is already present.
#> Adding another scale for fill, which will replace the existing scale.


layout <- "
AAAABB
AAAACC
DDEEFF
"

#The original figure includes the commented-out lines building the Kp1 rPinecone tree on top of Fig3
#As running rPinecone over the Kp1 tree takes a substantial amount of time, this is commented out for convenience.
#To recreate the full figure, remove comments from the Kp1 rPinecone analysis lines and substitute Fig3 with Kp1_tree here:

Fig3 + Kp2_tree + Kp3_tree + ST35_tree_2 + ST39_tree_2 + ST1415_tree_2 + plot_layout(design = layout) + plot_annotation(title = "Figure 3", tag_levels = "A", tag_suffix = ")")
#> Warning: Removed 37 rows containing missing values
#> (`geom_point_g_gtree()`).
#> Warning: Removed 34 rows containing missing values
#> (`geom_point_g_gtree()`).
#> Warning: Removed 4 rows containing missing values
#> (`geom_point_g_gtree()`).
#> Warning: Removed 26 rows containing missing values
#> (`geom_point_g_gtree()`).
#> Warning: Removed 72 rows containing missing values
#> (`geom_point_g_gtree()`).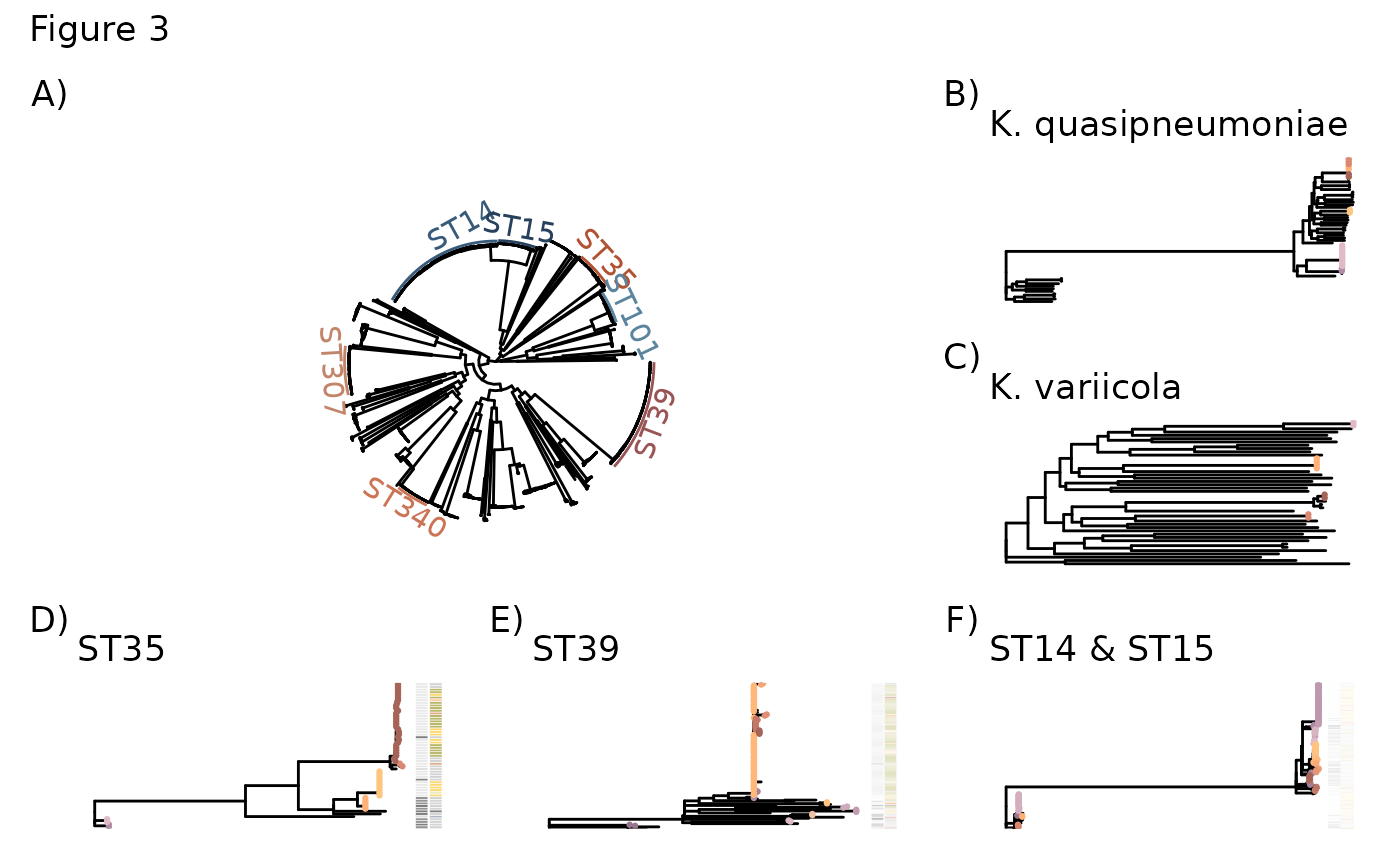
#Plotting the resistance phenotypes

Chlam30 <- ggplot(na.omit(LIMS_kleborate %>% group_by(DATE, `Chloramphenicol 30`) %>% summarize(n()))) + geom_bar(aes(x=DATE, y=`n()`, group=`Chloramphenicol 30`, fill=`Chloramphenicol 30`), stat="identity", position="fill") + theme_bw() + scale_fill_manual(values=c("#A79CA5","#D3A3A1","#83CDC0")) + theme(axis.text.x = element_text(angle = 90, hjust = 1), legend.position = "none") + xlab("Date") + ylab("Proportion") + ggtitle("Chloramphenicol 30")
#> `summarise()` has grouped output by 'DATE'. You can override using the
#> `.groups` argument.

Amk30 <- ggplot(na.omit(LIMS_kleborate %>% group_by(DATE, `Amikacin 30`) %>% summarize(n()))) + geom_bar(aes(x=DATE, y=`n()`, group=`Amikacin 30`, fill=`Amikacin 30`), stat="identity", position="fill") + theme_bw() + scale_fill_manual(values=c("#A79CA5","#D3A3A1","#83CDC0")) + theme(axis.text.x = element_text(angle = 90, hjust = 1), legend.position = "none") + xlab("Date") + ylab("Proportion") + ggtitle("Amikacin 30")
#> `summarise()` has grouped output by 'DATE'. You can override using the
#> `.groups` argument.

Aug30 <- ggplot(na.omit(LIMS_kleborate %>% group_by(DATE, `Augmentin 30`) %>% summarize(n()))) + geom_bar(aes(x=DATE, y=`n()`, group=`Augmentin 30`, fill=`Augmentin 30`), stat="identity", position="fill") + theme_bw() + scale_fill_manual(values=c("#A79CA5","#D3A3A1","#83CDC0")) + theme(axis.text.x = element_text(angle = 90, hjust = 1), legend.position = "none") + xlab("Date") + ylab("Proportion") + ggtitle("Augmentin 30")
#> `summarise()` has grouped output by 'DATE'. You can override using the
#> `.groups` argument.

Cip5 <- ggplot(na.omit(LIMS_kleborate %>% group_by(DATE, `Ciprofloxacin 5`) %>% summarize(n()))) + geom_bar(aes(x=DATE, y=`n()`, group=`Ciprofloxacin 5`, fill=`Ciprofloxacin 5`), stat="identity", position="fill") + theme_bw() + scale_fill_manual(values=c("#A79CA5","#D3A3A1","#83CDC0")) + theme(axis.text.x = element_text(angle = 90, hjust = 1), legend.position = "none") + xlab("Date") + ylab("Proportion") + ggtitle("Ciprofloxacin 5")
#> `summarise()` has grouped output by 'DATE'. You can override using the
#> `.groups` argument.

Mer10 <- ggplot(na.omit(LIMS_kleborate %>% group_by(DATE, `Meropenem 10`) %>% summarize(n()))) + geom_bar(aes(x=DATE, y=`n()`, group=`Meropenem 10`, fill=`Meropenem 10`), stat="identity", position="fill") + theme_bw() + scale_fill_manual(values=c("#A79CA5","lightgrey","#83CDC0")) + theme(axis.text.x = element_text(angle = 90, hjust = 1), legend.position = "none") + xlab("Date") + ylab("Proportion") + ggtitle("Meropenem 10")
#> `summarise()` has grouped output by 'DATE'. You can override using the
#> `.groups` argument.

Cotri25 <- ggplot(na.omit(LIMS_kleborate %>% group_by(DATE, `Cotrimoxazole 25`) %>% summarize(n()))) + geom_bar(aes(x=DATE, y=`n()`, group=`Cotrimoxazole 25`, fill=`Cotrimoxazole 25`), stat="identity", position="fill") + theme_bw() + scale_fill_manual(values=c("#D3A3A1","#83CDC0")) + theme(axis.text.x = element_text(angle = 90, hjust = 1), legend.position="none") + xlab("Date") + ylab("Proportion") + ggtitle("Cotrimoxazole 25")
#> `summarise()` has grouped output by 'DATE'. You can override using the
#> `.groups` argument.

Gent10 <- ggplot(na.omit(LIMS_kleborate %>% group_by(DATE, `Gentamicin 10`) %>% summarize(n()))) + geom_bar(aes(x=DATE, y=`n()`, group=`Gentamicin 10`, fill=`Gentamicin 10`), stat="identity", position="fill") + theme_bw() + scale_fill_manual(values=c("#A79CA5","#D3A3A1","#83CDC0")) + theme(axis.text.x = element_text(angle = 90, hjust = 1), legend.position="none") + xlab("Date") + ylab("Proportion") + ggtitle("Gentamicin 10")
#> `summarise()` has grouped output by 'DATE'. You can override using the
#> `.groups` argument.

TAZ36 <- ggplot(na.omit(LIMS_kleborate %>% group_by(DATE, `Piperacillin/Tazobactam 36`) %>% summarize(n()))) + geom_bar(aes(x=DATE, y=`n()`, group=`Piperacillin/Tazobactam 36`, fill=`Piperacillin/Tazobactam 36`), stat="identity", position="fill") + theme_bw() + scale_fill_manual(values=c("#A79CA5", "lightgrey", "#D3A3A1","#83CDC0"), name = "Phenotypes") + theme(axis.text.x = element_text(angle = 90, hjust = 1)) + theme(legend.key.size = unit(0.2, 'cm')) + xlab("Date") + ylab("Proportion") + ggtitle("Pip/Taz 36")
#> `summarise()` has grouped output by 'DATE'. You can override using the
#> `.groups` argument.

Cfx10 <- ggplot(na.omit(LIMS_kleborate %>% group_by(DATE, `Cefpodoxime 10 (Ceftriaxone)`) %>% summarize(n()))) + geom_bar(aes(x=DATE, y=`n()`, group=`Cefpodoxime 10 (Ceftriaxone)`, fill=`Cefpodoxime 10 (Ceftriaxone)`), stat="identity", position="fill") + theme_bw() + scale_fill_manual(values=c("#D3A3A1","#83CDC0")) + theme(axis.text.x = element_text(angle = 90, hjust = 1), legend.position="none") + xlab("Date") + ylab("Proportion") + ggtitle("Cefpodoxime 10")
#> `summarise()` has grouped output by 'DATE'. You can override using the
#> `.groups` argument.

Cxi30 <- ggplot(na.omit(LIMS_kleborate %>% group_by(DATE, `Cefoxitin 30`) %>% summarize(n()))) + geom_bar(aes(x=DATE, y=`n()`, group=`Cefoxitin 30`, fill=`Cefoxitin 30`), stat="identity", position="fill") + theme_bw() + scale_fill_manual(values=c("lightgrey", "#D3A3A1","#83CDC0")) + theme(axis.text.x = element_text(angle = 90, hjust = 1), legend.position="none") + xlab("Date") + ylab("Proportion") + ggtitle("Cefoxitin 30")
#> `summarise()` has grouped output by 'DATE'. You can override using the
#> `.groups` argument.

Cfx10 + Aug30 + Gent10 + Cotri25 + Cip5 + Amk30 + Chlam30 + plot_spacer() + TAZ36 + Mer10 + Cxi30 + plot_layout(nrow = 3, ncol = 4) + plot_annotation(title = "Figure S4", tag_levels = "A", tag_suffix = ")") + plot_layout(guides = "collect")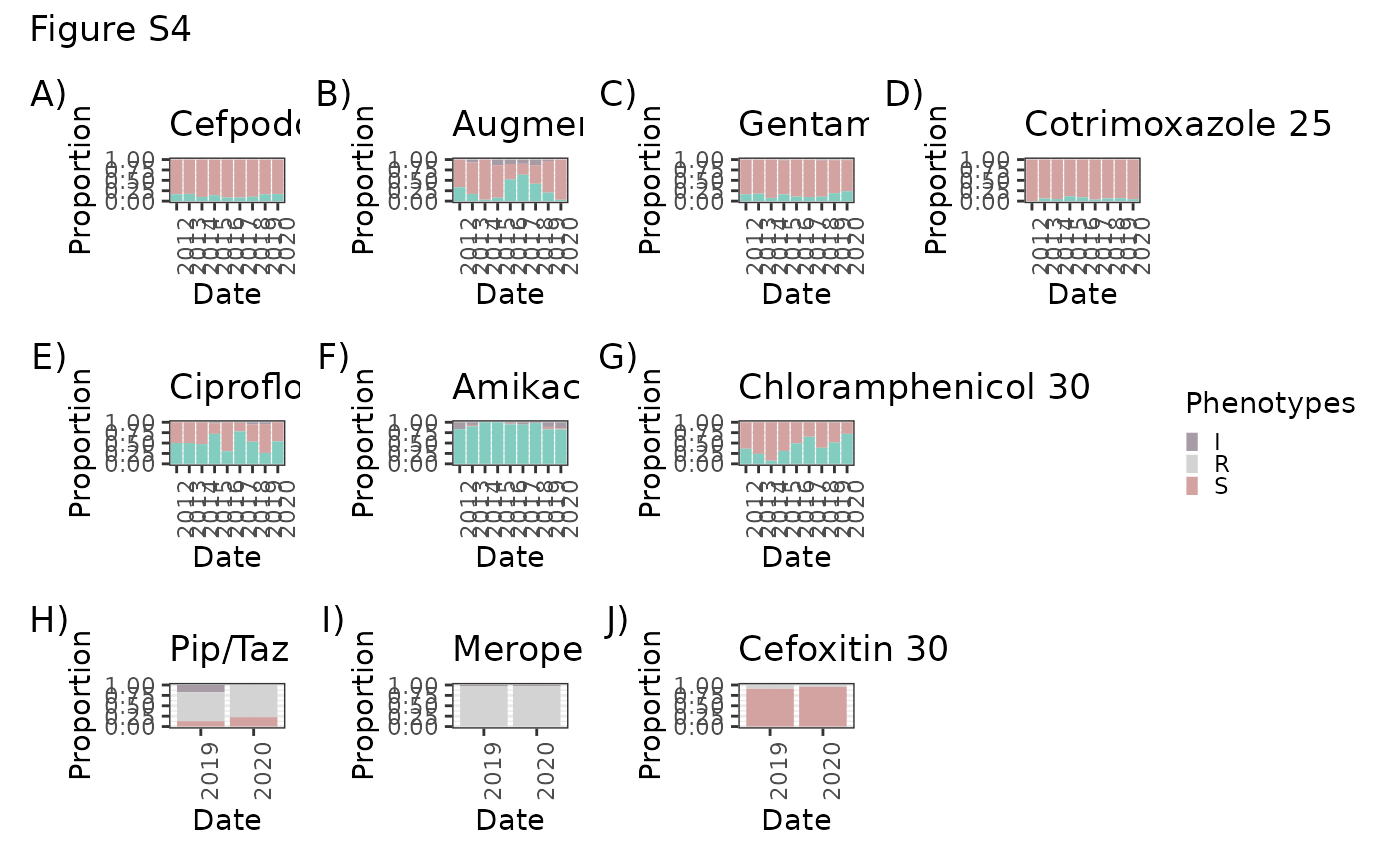
O- and K-type figures
O_new$clean_locus <- O_new$Best.match.locus
O_new$clean_type <- O_new$Best.match.type

O_new[O_new$Match.confidence == "Low",]$clean_type <- "unknown"
O_new[O_new$Match.confidence == "Low",]$clean_locus <- "unknown"
O_new[O_new$Match.confidence == "None",]$clean_type <- "unknown"
O_new[O_new$Match.confidence == "None",]$clean_locus <- "unknown"

K_new$clean_locus <- K_new$Best.match.locus
K_new$clean_type <- K_new$Best.match.type

K_new[K_new$Match.confidence == "Low",]$clean_type <- "unknown"
K_new[K_new$Match.confidence == "Low",]$clean_locus <- "unknown"
K_new[K_new$Match.confidence == "None",]$clean_type <- "unknown"
K_new[K_new$Match.confidence == "None",]$clean_locus <- "unknown"

O_K_new <- inner_join(O_new[,c(1, 18, 19)], K_new[,c(1,18,19)], by="Assembly")

O_K_new_kleborate <- inner_join(O_K_new, kleborate_big[,c("strain", "DATE", "main_ST", "Bla_ESBL_acquired")], by=c("Assembly"="strain"))

O_over_time <- as.data.frame(table(O_K_new_kleborate[!is.na(O_K_new_kleborate$DATE) & O_K_new_kleborate$DATE > 1999,]$DATE, O_K_new_kleborate[!is.na(O_K_new_kleborate$DATE) & O_K_new_kleborate$DATE > 1999,]$clean_locus.x), stringsAsFactors = FALSE)
O_over_time$Var1 <- as.numeric(O_over_time$Var1)

O_time <- ggplot(O_over_time, aes(x=Var1, y=Freq, fill=Var2)) + geom_area() + scale_fill_manual(values = O_colours, name="O locus") + theme_bw() + theme(axis.text.x = element_text(angle = 90, hjust = 1)) + xlab("Date") + ylab("Number of isolates") + ggtitle("O-locus over time") + ylim(0, 250) + theme(legend.key.size = unit(0.3, 'cm'))

O_sensitive_over_time <- as.data.frame(table(O_K_new_kleborate[O_K_new_kleborate$Bla_ESBL_acquired == "-" & !is.na(O_K_new_kleborate$DATE) & O_K_new_kleborate$DATE > 1999,]$DATE, O_K_new_kleborate[O_K_new_kleborate$Bla_ESBL_acquired == "-" & !is.na(O_K_new_kleborate$DATE) & O_K_new_kleborate$DATE > 1999,]$clean_locus.x), stringsAsFactors = FALSE)
O_sensitive_over_time$Var1 <- as.numeric(O_sensitive_over_time$Var1)

O_sens <- ggplot(O_sensitive_over_time, aes(x=Var1, y=Freq, fill=Var2)) + geom_col(position="fill") + scale_fill_manual(values = O_colours, name="O locus") + theme_bw() + theme(axis.text.x = element_text(angle = 90, hjust = 1),  legend.position="none") + xlab("Date") + ylab("Number of non-ESBL isolates") + ggtitle("O-locus non-ESBL over time")

O_resistant_over_time <- as.data.frame(table(O_K_new_kleborate[O_K_new_kleborate$Bla_ESBL_acquired != "-" & !is.na(O_K_new_kleborate$DATE) & O_K_new_kleborate$DATE > 1999,]$DATE, O_K_new_kleborate[O_K_new_kleborate$Bla_ESBL_acquired != "-" & !is.na(O_K_new_kleborate$DATE) & O_K_new_kleborate$DATE > 1999,]$clean_locus.x), stringsAsFactors = FALSE)
O_resistant_over_time$Var1 <- as.numeric(O_resistant_over_time$Var1)

O_res <- ggplot(O_resistant_over_time, aes(x=Var1, y=Freq, fill=Var2)) + geom_col(position="fill") + scale_fill_manual(values = O_colours, name="O locus") + theme_bw() + theme(axis.text.x = element_text(angle = 90, hjust = 1), legend.position="none") + xlab("Date") + ylab("Number of ESBL isolates") + ggtitle("O-locus ESBL+ over time")


Otype_over_time <- as.data.frame(table(O_K_new_kleborate[!is.na(O_K_new_kleborate$DATE) & O_K_new_kleborate$DATE > 1999,]$DATE, O_K_new_kleborate[!is.na(O_K_new_kleborate$DATE) & O_K_new_kleborate$DATE > 1999,]$clean_type.x), stringsAsFactors = FALSE)
Otype_over_time$Var1 <- as.numeric(Otype_over_time$Var1)

Ot_time <- ggplot(Otype_over_time, aes(x=Var1, y=Freq, fill=Var2)) + geom_area() + scale_fill_manual(values = O_type_colours, name="O serotype") + theme_bw() + theme(axis.text.x = element_text(angle = 90, hjust = 1)) + xlab("Date") + ylab("Number of isolates") + ggtitle("O-type over time") + ylim(0, 250) + theme(legend.key.size = unit(0.3, 'cm'))

Otype_sensitive_over_time <- as.data.frame(table(O_K_new_kleborate[O_K_new_kleborate$Bla_ESBL_acquired == "-" & !is.na(O_K_new_kleborate$DATE) & O_K_new_kleborate$DATE > 1999,]$DATE, O_K_new_kleborate[O_K_new_kleborate$Bla_ESBL_acquired == "-" & !is.na(O_K_new_kleborate$DATE) & O_K_new_kleborate$DATE > 1999,]$clean_type.x), stringsAsFactors = FALSE)
Otype_sensitive_over_time$Var1 <- as.numeric(Otype_sensitive_over_time$Var1)

Ots_time <- ggplot(Otype_sensitive_over_time, aes(x=Var1, y=Freq, fill=Var2)) + geom_col(position="fill") + scale_fill_manual(values = O_type_colours, name="O serotype") + theme_bw() + theme(axis.text.x = element_text(angle = 90, hjust = 1), legend.position="none") + xlab("Date") + ylab("Number of non-ESBL isolates") + ggtitle("O-type non-ESBL over time")

Otype_resistant_over_time <- as.data.frame(table(O_K_new_kleborate[O_K_new_kleborate$Bla_ESBL_acquired != "-" & !is.na(O_K_new_kleborate$DATE) & O_K_new_kleborate$DATE > 1999,]$DATE, O_K_new_kleborate[O_K_new_kleborate$Bla_ESBL_acquired != "-" & !is.na(O_K_new_kleborate$DATE) & O_K_new_kleborate$DATE > 1999,]$clean_type.x), stringsAsFactors = FALSE)
Otype_resistant_over_time$Var1 <- as.numeric(Otype_resistant_over_time$Var1)

Otr_time <- ggplot(Otype_resistant_over_time, aes(x=Var1, y=Freq, fill=Var2)) + geom_col(position="fill") + scale_fill_manual(values = O_type_colours, name="O serotype") + theme_bw() + theme(axis.text.x = element_text(angle = 90, hjust = 1), legend.position="none") + xlab("Date") + ylab("Number of ESBL+ isolates") + ggtitle("O-type ESBL+ over time")

main_K <- c("KL102", "KL103", "KL106", "KL112", "KL122", "KL15", "KL16", "KL17", "KL19", "KL2", "KL20", "KL23", "KL24", "KL25", "KL27", "KL3", "KL30", "KL43", "KL48", "KL51", "KL52", "KL57", "KL62", "KL64", "KL9", "unknown")

O_K_new_kleborate$main_K <- O_K_new_kleborate$clean_locus.y
O_K_new_kleborate[O_K_new_kleborate$clean_locus.y %nin% main_K,]$main_K <- "other"

K_over_time <- as.data.frame(table(O_K_new_kleborate[!is.na(O_K_new_kleborate$DATE) & O_K_new_kleborate$DATE > 1999,]$DATE, O_K_new_kleborate[!is.na(O_K_new_kleborate$DATE) & O_K_new_kleborate$DATE > 1999,]$main_K), stringsAsFactors = FALSE)
K_over_time$Var1 <- as.numeric(K_over_time$Var1)

K_time <- ggplot(K_over_time, aes(x=Var1, y=Freq, fill=Var2)) + geom_area() + scale_fill_manual(values = K_col, name="K locus") + theme_bw() + theme(axis.text.x = element_text(angle = 90, hjust = 1)) + xlab("Date") + ylab("Number of isolates") + ggtitle("K-locus over time") + ylim(0, 250) + theme(legend.key.size = unit(0.3, 'cm'))

K_sensitive_over_time <- as.data.frame(table(O_K_new_kleborate[O_K_new_kleborate$Bla_ESBL_acquired == "-" & !is.na(O_K_new_kleborate$DATE) & O_K_new_kleborate$DATE > 1999,]$DATE, O_K_new_kleborate[O_K_new_kleborate$Bla_ESBL_acquired == "-" & !is.na(O_K_new_kleborate$DATE) & O_K_new_kleborate$DATE > 1999,]$main_K), stringsAsFactors = FALSE)
K_sensitive_over_time$Var1 <- as.numeric(K_sensitive_over_time$Var1)

Ks_time <- ggplot(K_sensitive_over_time, aes(x=Var1, y=Freq, fill=Var2)) + geom_col(position="fill") + scale_fill_manual(values = K_col, name="K type") + theme_bw() + theme(axis.text.x = element_text(angle = 90, hjust = 1), legend.position="none") + xlab("Date") + ylab("Number of non-ESBL isolates") + ggtitle("K-locus non-ESBL over time")

K_resistant_over_time <- as.data.frame(table(O_K_new_kleborate[O_K_new_kleborate$Bla_ESBL_acquired != "-" & !is.na(O_K_new_kleborate$DATE) & O_K_new_kleborate$DATE > 1999,]$DATE, O_K_new_kleborate[O_K_new_kleborate$Bla_ESBL_acquired != "-" & !is.na(O_K_new_kleborate$DATE) & O_K_new_kleborate$DATE > 1999,]$main_K), stringsAsFactors = FALSE)
K_resistant_over_time$Var1 <- as.numeric(K_resistant_over_time$Var1)

Kr_time <- ggplot(K_resistant_over_time, aes(x=Var1, y=Freq, fill=Var2)) + geom_col(position="fill") + scale_fill_manual(values = K_col, name="K type") + theme_bw() + theme(axis.text.x = element_text(angle = 90, hjust = 1), legend.position="none") + xlab("Date") + ylab("Number of ESBL+ isolates") + ggtitle("K-locus ESBL+ over time")

O_K_comb <- as.data.frame(O_K_new_kleborate %>% group_by(clean_locus.x, clean_locus.y) %>% summarize(n()))
#> `summarise()` has grouped output by 'clean_locus.x'. You can override using the
#> `.groups` argument.
colnames(O_K_comb) <- c("O_locus", "K_locus", "number")

OK <- ggplot(O_K_comb, aes(x=O_locus, y=K_locus)) + geom_point(aes(size=number, color=K_locus), alpha=0.5) + theme_bw() + theme(axis.text.x = element_text(angle = 90, hjust = 1), legend.position="none", axis.text.y = element_text(size = 4)) + ggtitle("O- vs. K-locus abundance") + scale_color_manual(values = K_col, name="K type") + xlab("Main O-locus") + ylab ("Main K-locus")

Otype_K_comb <- as.data.frame(O_K_new_kleborate %>% group_by(clean_type.x, clean_locus.y) %>% summarize(n()))
#> `summarise()` has grouped output by 'clean_type.x'. You can override using the
#> `.groups` argument.
colnames(Otype_K_comb) <- c("O_type", "K_locus", "number")

OtK <- ggplot(Otype_K_comb, aes(x=O_type, y=K_locus)) + geom_point(aes(size=number, color = K_locus), alpha=0.5) + theme_bw() + theme(axis.text.x = element_text(angle = 90, hjust = 1), axis.text.y = element_text(size = 4)) + ggtitle("O-type vs. K-locus abundance") + scale_color_manual(values = K_col, name="K type") + xlab("Main O-type") + ylab("Main K-locus") + guides(size="none")

ST_K_comb <- as.data.frame(O_K_new_kleborate %>% group_by(main_ST, clean_locus.y) %>% summarize(n()))
#> `summarise()` has grouped output by 'main_ST'. You can override using the
#> `.groups` argument.
colnames(ST_K_comb) <- c("mainST", "K_locus", "number")

STK <- ggplot(ST_K_comb, aes(x=mainST, y=K_locus)) + geom_point(aes(size=number, color=K_locus), alpha=0.5) + theme_bw() + theme(axis.text.x = element_text(angle = 90, hjust = 1), legend.position="none", axis.text.y = element_text(size = 4)) + ggtitle("Main STs vs. K-locus abundance") + scale_color_manual(values = K_col, name="K type") + xlab("Main ST") + ylab("Main K-locus")

ST_O_comb <- as.data.frame(O_K_new_kleborate %>% group_by(main_ST, clean_locus.x) %>% summarize(n()))
#> `summarise()` has grouped output by 'main_ST'. You can override using the
#> `.groups` argument.
colnames(ST_O_comb) <- c("mainST", "O_locus", "number")

STO <- ggplot(ST_O_comb, aes(x=mainST, y=O_locus)) + geom_point(aes(size=number, color=O_locus), alpha=0.5) + theme_bw() + theme(axis.text.x = element_text(angle = 90, hjust = 1), legend.position="none") + ggtitle("Main STs vs. O-locus abundance") + scale_color_manual(values = O_colours, name="O locus") + xlab("Main ST") + ylab("Main O-locus")

ST_O_type_comb <- as.data.frame(O_K_new_kleborate %>% group_by(main_ST, clean_type.x) %>% summarize(n()))
#> `summarise()` has grouped output by 'main_ST'. You can override using the
#> `.groups` argument.
colnames(ST_O_type_comb) <- c("mainST", "O_type", "number")

STOt <- ggplot(ST_O_type_comb, aes(x=mainST, y=O_type)) + geom_point(aes(size=number, color=O_type), alpha=0.5) + theme_bw() + theme(axis.text.x = element_text(angle = 90, hjust = 1), legend.position="none") + ggtitle("Main STs vs. O-type abundance") + scale_color_manual(values = O_type_colours, name="O type") + xlab("Main ST") + ylab("Main O-type")

O_time + O_sens + O_res + K_time + Ks_time + Kr_time + STO + STK + OK + plot_layout(nrow = 3, ncol = 3) + plot_annotation(title = "Figure 5", tag_levels = "A", tag_suffix = ")") + plot_layout(guides = "collect")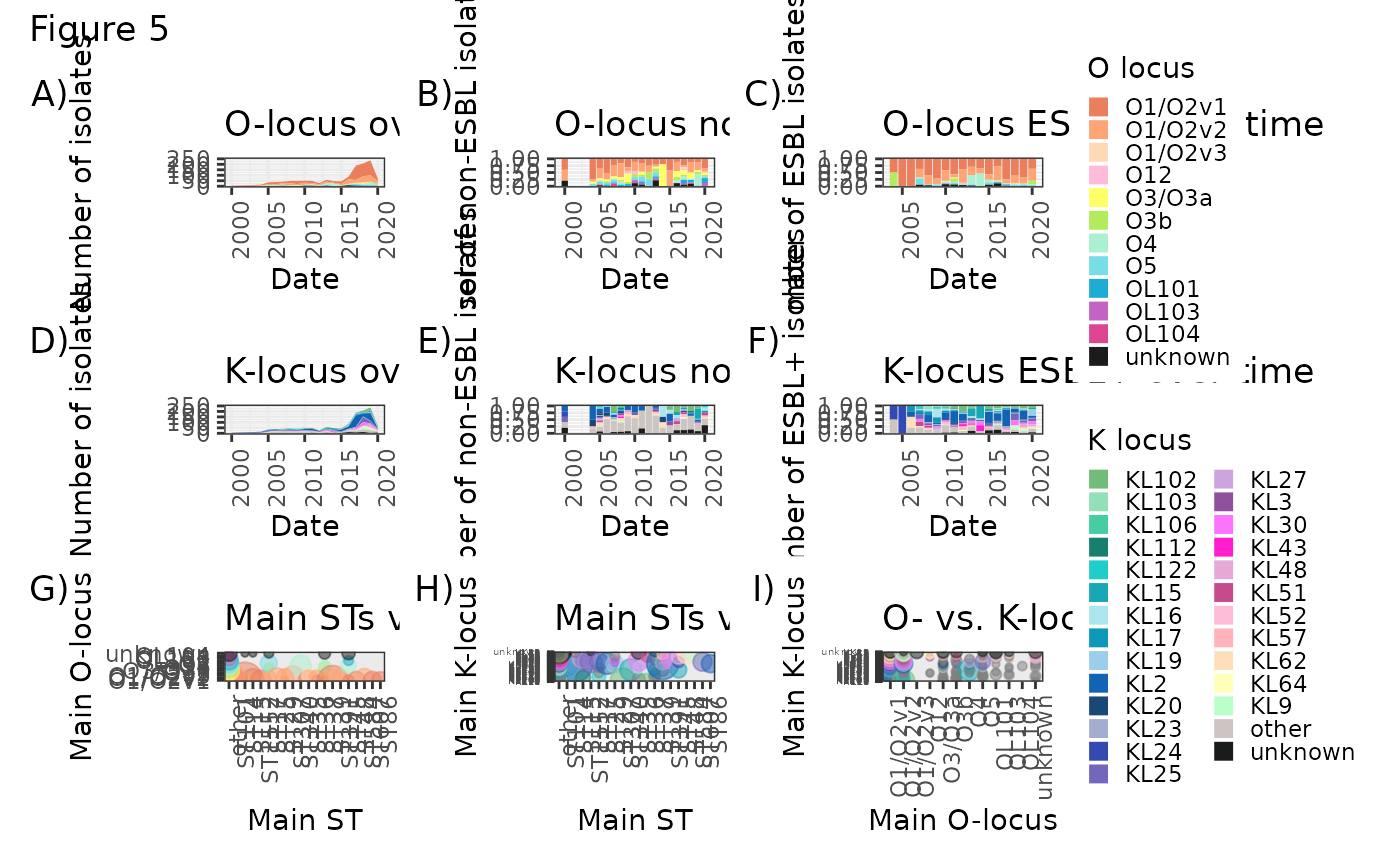
Ot_time + Ots_time+ Otr_time + plot_layout(guides = "collect") + STOt + OtK + plot_layout(nrow = 2, ncol = 3) + plot_annotation(title = "Figure S7", tag_levels = "A", tag_suffix = ")") 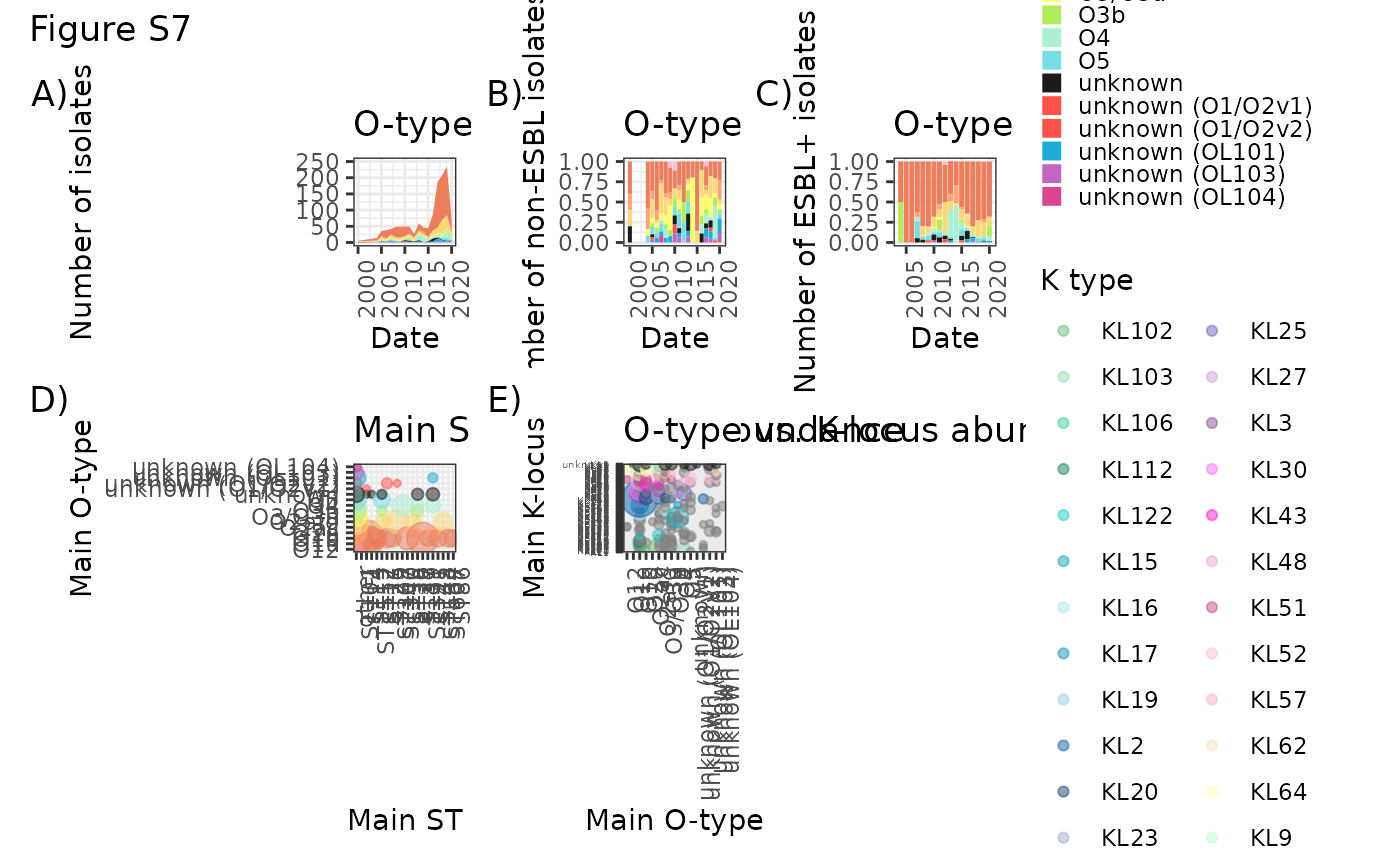
Reproducability, session info
sessionInfo()
#> R version 4.3.1 (2023-06-16)
#> Platform: x86_64-pc-linux-gnu (64-bit)
#> Running under: Ubuntu 22.04.3 LTS
#>
#> Matrix products: default
#> BLAS:   /usr/lib/x86_64-linux-gnu/openblas-pthread/libblas.so.3
#> LAPACK: /usr/lib/x86_64-linux-gnu/openblas-pthread/libopenblasp-r0.3.20.so;  LAPACK version 3.10.0
#>
#> locale:
#>  [1] LC_CTYPE=C.UTF-8       LC_NUMERIC=C           LC_TIME=C.UTF-8
#>  [4] LC_COLLATE=C.UTF-8     LC_MONETARY=C.UTF-8    LC_MESSAGES=C.UTF-8
#>  [7] LC_PAPER=C.UTF-8       LC_NAME=C              LC_ADDRESS=C
#> [10] LC_TELEPHONE=C         LC_MEASUREMENT=C.UTF-8 LC_IDENTIFICATION=C
#>
#> time zone: UTC
#> tzcode source: system (glibc)
#>
#> attached base packages:
#> [1] stats     graphics  grDevices utils     datasets  methods   base
#>
#> other attached packages:
#>  [1] castor_1.7.11               Rcpp_1.0.11
#>  [3] reshape2_1.4.4              rPinecone_0.1.0
#>  [5] patchwork_1.1.3             lubridate_1.9.3
#>  [7] forcats_1.0.0               stringr_1.5.0
#>  [9] dplyr_1.1.3                 purrr_1.0.2
#> [11] readr_2.1.4                 tidyr_1.3.0
#> [13] tibble_3.2.1                tidyverse_2.0.0
#> [15] ggplot2_3.4.3               ggnewscale_0.4.9
#> [17] ggtree_3.9.1                MetBrewer_0.2.0
#> [19] QECHospitalKlebs_0.0.0.9000
#>
#> loaded via a namespace (and not attached):
#>  [1] tidyselect_1.2.0        subplex_1.8             farver_2.1.1
#>  [4] phytools_1.9-16         optimParallel_1.0-2     fastmap_1.1.1
#>  [7] lazyeval_0.2.2          combinat_0.0-8          digest_0.6.33
#> [10] timechange_0.2.0        lifecycle_1.0.3         tidytree_0.4.5
#> [13] magrittr_2.0.3          compiler_4.3.1          rlang_1.1.1
#> [16] sass_0.4.7              tools_4.3.1             plotrix_3.8-2
#> [19] igraph_1.5.1            utf8_1.2.3              yaml_2.3.7
#> [22] phangorn_2.11.1         knitr_1.44              clusterGeneration_1.3.8
#> [25] labeling_0.4.3          scatterplot3d_0.3-44    mnormt_2.1.1
#> [28] plyr_1.8.9              RColorBrewer_1.1-3      aplot_0.2.1
#> [31] expm_0.999-7            withr_2.5.1             numDeriv_2016.8-1.1
#> [34] desc_1.4.2              grid_4.3.1              fansi_1.0.4
#> [37] colorspace_2.1-0        scales_1.2.1            iterators_1.0.14
#> [40] MASS_7.3-60             cli_3.6.1               mvtnorm_1.2-3
#> [43] rmarkdown_2.25          ragg_1.2.5              treeio_1.25.4
#> [46] generics_0.1.3          RSpectra_0.16-1         tzdb_0.4.0
#> [49] naturalsort_0.1.3       ape_5.7-1               cachem_1.0.8
#> [52] maps_3.4.1              parallel_4.3.1          ggplotify_0.1.2
#> [55] geiger_2.0.11           yulab.utils_0.1.0       vctrs_0.6.3
#> [58] Matrix_1.6-1.1          jsonlite_1.8.7          gridGraphics_0.5-1
#> [61] hms_1.1.3               systemfonts_1.0.4       foreach_1.5.2
#> [64] jquerylib_0.1.4         glue_1.6.2              pkgdown_2.0.7
#> [67] codetools_0.2-19        stringi_1.7.12          gtable_0.3.4
#> [70] quadprog_1.5-8          munsell_0.5.0           pillar_1.9.0
#> [73] htmltools_0.5.6         deSolve_1.38            R6_2.5.1
#> [76] textshaping_0.3.6       doParallel_1.0.17       rprojroot_2.0.3
#> [79] evaluate_0.22           lattice_0.21-8          memoise_2.0.1
#> [82] ggfun_0.1.3             bslib_0.5.1             fastmatch_1.1-4
#> [85] coda_0.19-4             nlme_3.1-162            xfun_0.40
#> [88] fs_1.6.3                pkgconfig_2.0.3